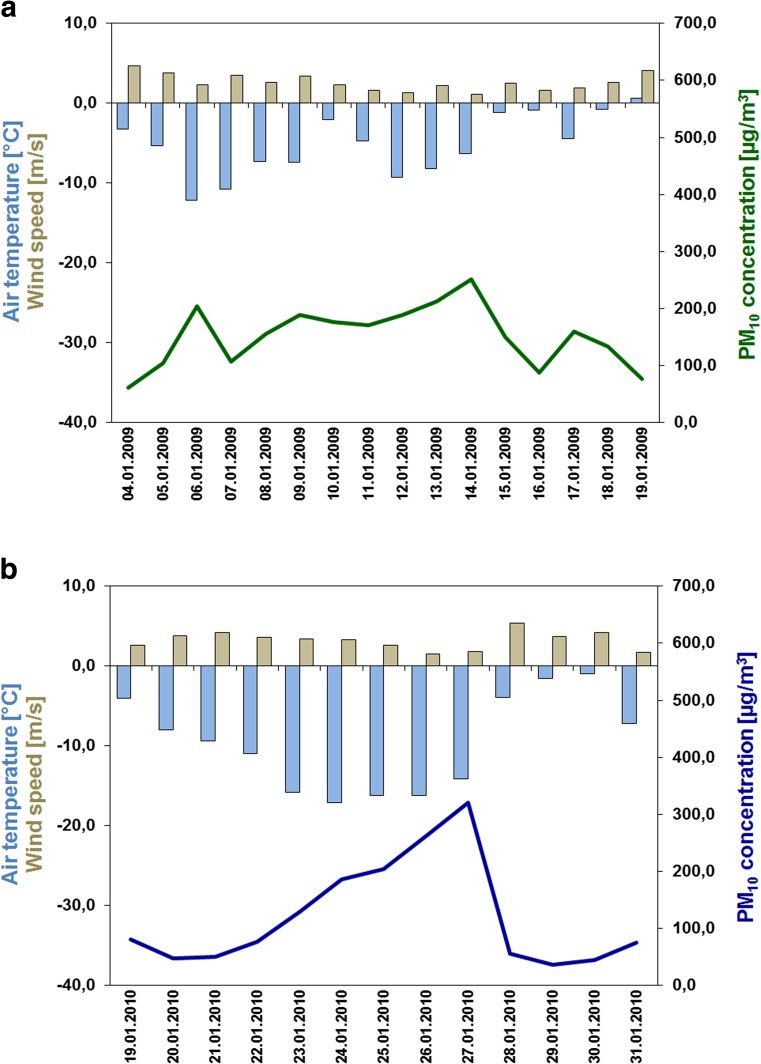
Fig. 4.
Patterns of daily PM10 concentrations (μg m−3) (colour solid lines) during the period of a 4–19th January 2009 and b 19–31th January 2010 averaged for urban background monitoring sites in comparison with daily mean of meteorological parameters: air temperature (°C) (blue bars) and wind speed (m s−1) (beige bars)

