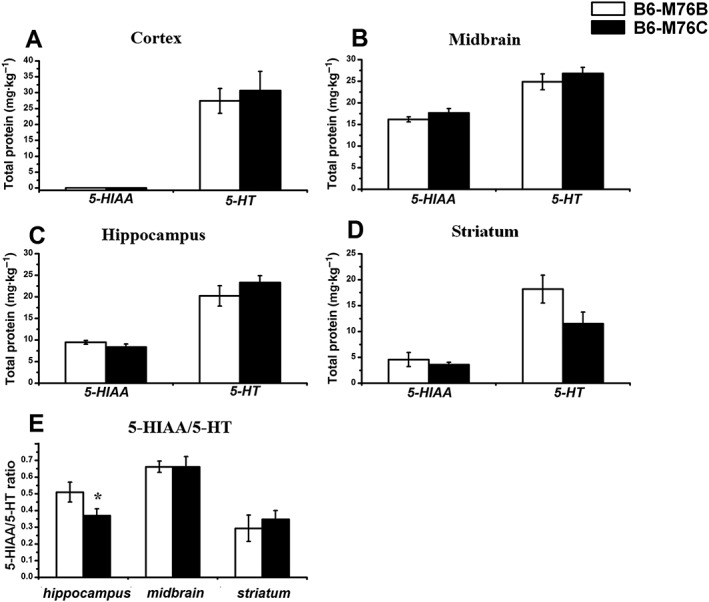
Figure 6.

Concentrations of 5‐HT and its main metabolite 5‐HIAA in the different brain areas of B6‐M76C and B6‐M76B lines are shown. (A) cortex, (B) midbrain, (C) hippocampus and (D) striatum. (E) 5‐HIAA/5‐HT ratio reflecting the efficiency of 5‐HT metabolism. Data are presented as mean ± SEM (n = 8 per genotype). * P < 0.05 versus B6‐M76B mice.
