
Figure 3.
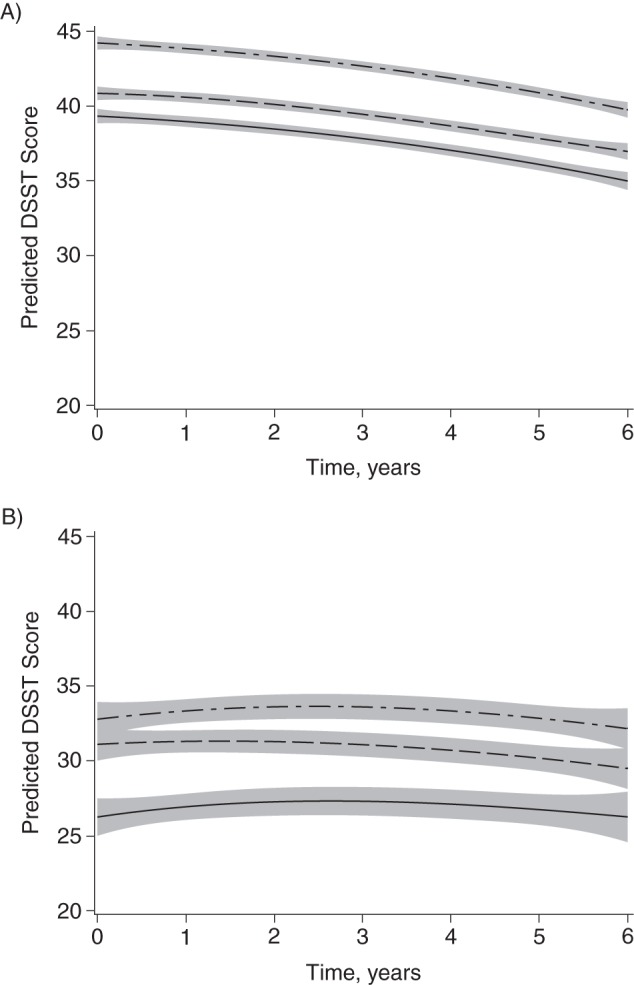
Predicted Digit Symbol Substitution Test (DSST) score by race and neighborhood socioeconomic status (SES) for (A) white and (B) black participants of average age (72 years), Cardiovascular Health Study, United States, 1992–1993. Top lines are for the highest tertile of neighborhood SES and bottom lines are for the lowest tertile. Adjusted for time squared, age, age × time, gender, sex, marital status, hypertension, diabetes, coronary heart disease, clinic location, individual SES (education, income, and occupational history), and white matter hyperintensities. Shading indicates 95% confidence interval.