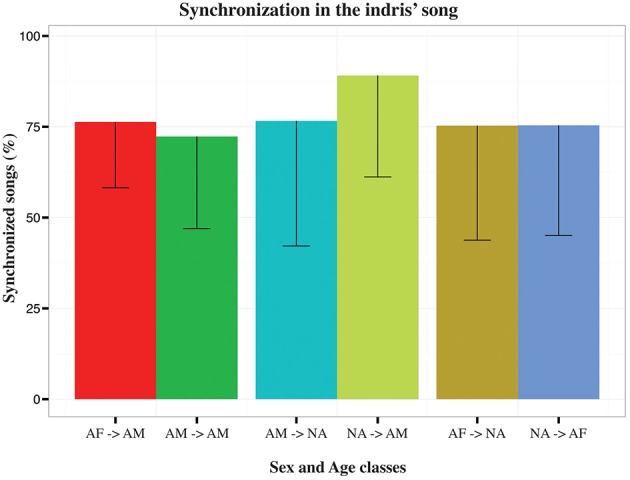
Figure 4.

Bar plot of the average percentage of synchronized songs in the indris. Capped lines represent negative Standard Deviation. Each bar indicates the direction of the Granger causality test for each type of dyad (AF, adult females; AM, adult males, NA, non-adults).
