Figure 9.
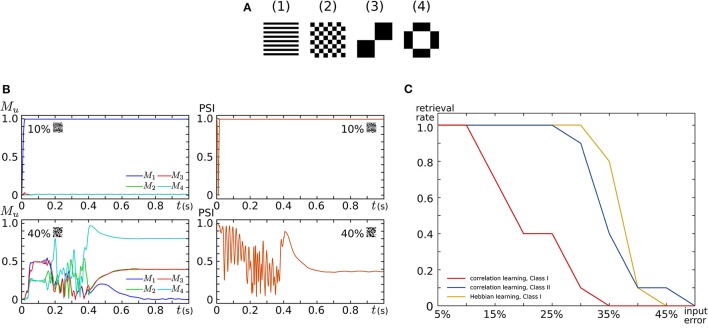
Auto-associative memory tasks executed in our all-to-all digital silicon neuronal networks. (A) Stored patterns. Each pattern is composed of 256 (16 × 16) pixels with a value of 1 or −1. Black (white) pixels have a value of 1 (−1). Reprinted with modification from Li et al. (2012). (B) Examples of the transition of Mu and PSI when the input pattern has 10 and 40% flipped pixels. Reprinted with modification from Li et al. (2012). (C) Error recovery performance when the patterns are stored by correlation learning and the SNs are in the Class I mode (red) and in the Class II mode (blue). The yellow plot is for the case where the patterns are stored by Hebbian-type spike-timing-dependent learning and the SNs are in the Class I mode. The horizontal axis is the ratio of the flipped pixels to the total number of pixels (the error level). The vertical axis represents the rate of successful retrieval rate. For each error level, 10 trials were executed. Reprinted with modification from Li et al. (2013).

