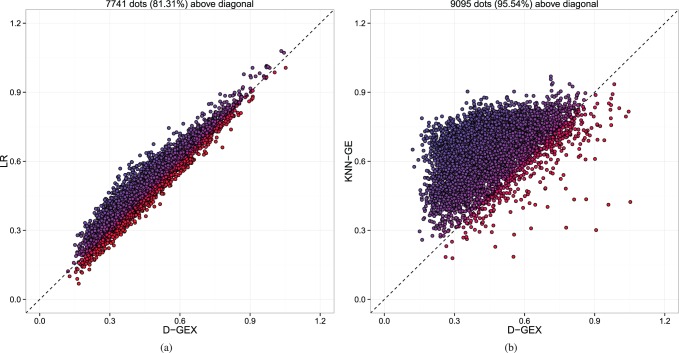
Fig. 4.
The predictive errors of each target gene by GEX-25%-9000 × 2 compared with LR and KNN-GE on GTEx-te. Each dot represents one out of the 9520 target genes. The x-axis is the MAE of each target gene by D-GEX, and the y-axis is the MAE of each target gene by the other method. Dots above diagonal means D-GEX achieves lower error compared with the other method. (a) D-GEX versus LR; (b) D-GEX versus KNN-GE

