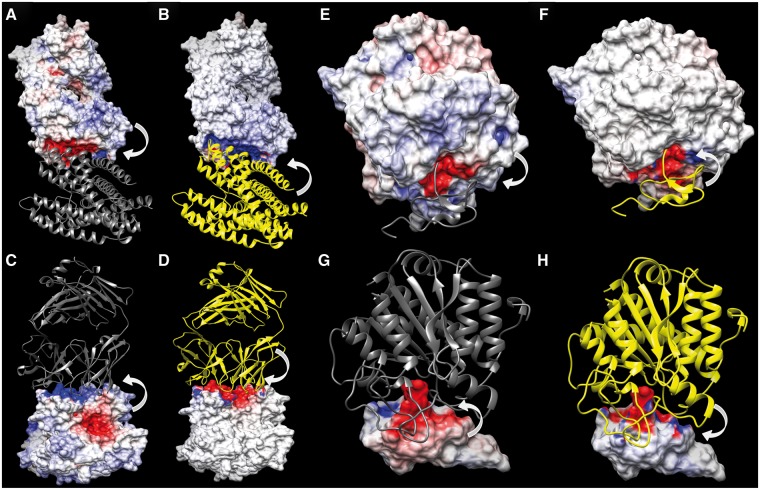
Fig. 6.
Electrostatic Potentials (ESP) mapped onto the molecular interfaces of the model 1K4C-a7d ranked by ProQDock and not by ZRANK2 (A–D), and model 4CPA-a1b ranked by ZRANK2 and not by ProQDock (E–H). In each figure panel (A–H), only one of the two molecular interfaces have been displayed, colored according to its ESP, either owing to the charged atoms of the molecule itself or owing to the partner molecule, while the other partners have been drawn in ribbon. The arrows pointing from a molecule to the surface illustrate from which molecule the ESP is generated. Surface coloring follows deep blue for high positive (10 kT/e) to deep red for high negative (−10 kT/e) ESPs. Ribbons are colored in yellow if the corresponding atoms are charged and dark gray if uncharged (dummy). The high anti-correlated ESP reflected in their contrasting ESP surface coloring leads to a high EC value (0.76) at the interface (compare A-B and C-D). The high correlated ESP reflected in their similar ESP surface coloring leads to a high negative EC value (−0.69) at the interface (compare E-F and G-H). (A and E) ESP mapped onto the interface of the receptor chain, owing to its own charged atoms. (B and F) ESP on the interface of the receptor chain, owing to the charged atoms of the ligand. (C and G) ESP mapped onto the interface of the ligand chain, owing to its own charged atoms. (D and H) ESP on the interface of the ligand chain, owing to the charged atoms of the receptor

