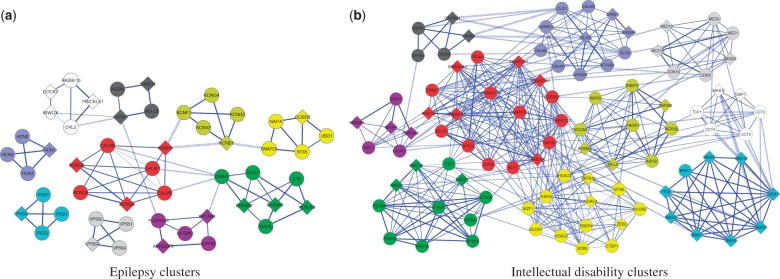
Fig. 5.
Predicted disease clusters for epilepsy and intellectual disability. These figures show the top ten ranked clusters predicted to play a role in (a) epilepsy and (b) intellectual disability. In each subfigure, different clusters are shown in distinct colors; the highest scoring cluster is colored red. Diamond nodes indicate genes from the prior. Three levels of edge thickness denote increasing ranges of interaction likelihood scores. Solid versus dashed edges denote intra-cluster versus inter-cluster interactions, respectively

