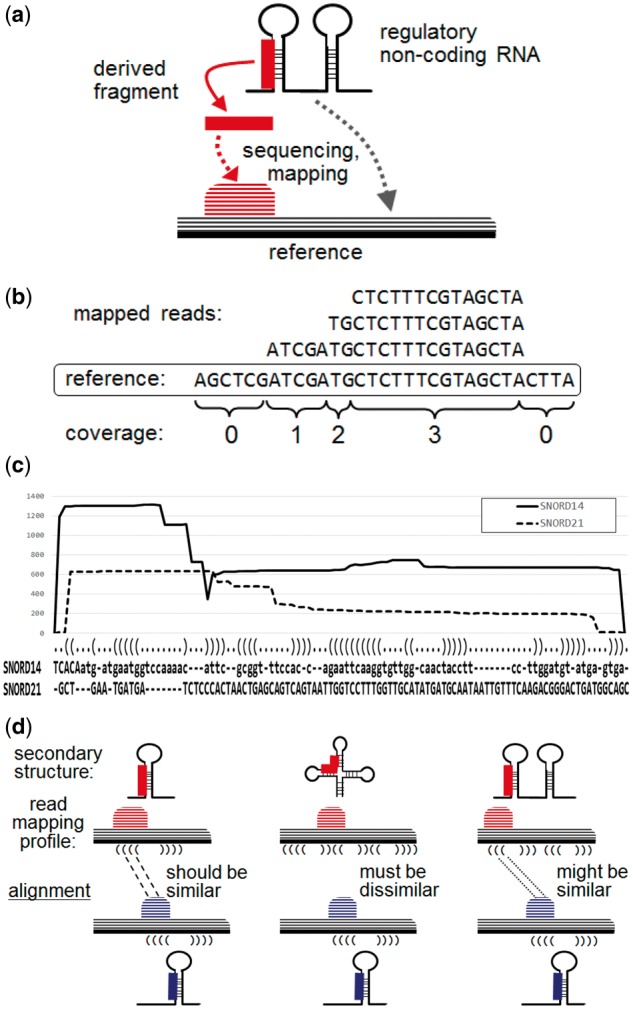
Fig. 1.

(a) Schematic illustration of a derived RNA fragment and the mapping pattern obtained from sequencing. (b) Read mapping profile and calculation of coverage. (c) An alignment of two read mapping profiles for SNORD14 and SNORD21 output by SHARAKU, using the small RNA-seq data for the common marmoset brain with the annotations of RNA sequence alignment and the predicted secondary structure. The solid line represents the read coverages of SNORD14, and the dashed line represents the read coverages of SNORD21. (d) Schematic illustration of the necessity of incorporating the primary and secondary structures of RNA sequences into an alignment
