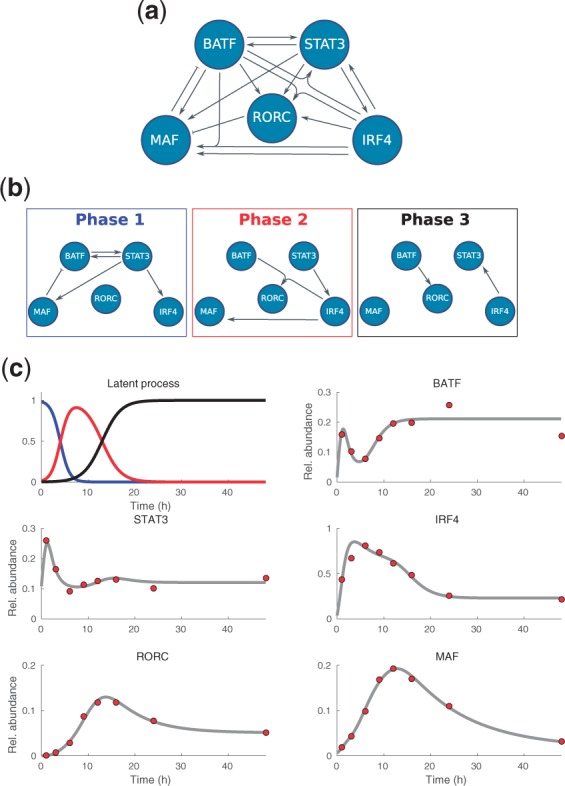
Fig. 4.

Experimentally validated core regulatory network steering Th17 lineage specification, inferred sequential subnetworks, and the predicted dynamics of the latent process and mRNA levels. (a) Full network which consists of all mechanistically possible interactions. (b) Predicted subnetworks that are active in three sequential phases. (c) Inferred dynamics (gray lines) plotted against experimental data (red circles). The color coding of the latent process corresponds to the three sequentially activated subnetworks shown above
