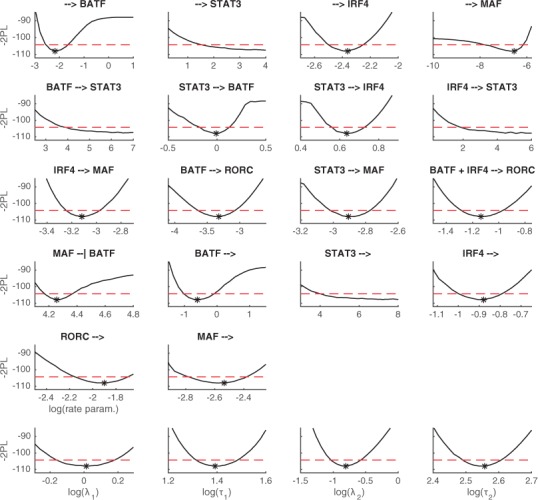
Fig. 5.

Parameter profile likelihood for the parameters of the inferred Th17 core network LEM model. The first five rows show the estimated profile likelihoods for the rate parameters and the bottom row shows the estimated profile likelihoods for the parameters of the latent process. The dashed red line shows the 95% confidence threshold and the asterisk shows the maximum likelihood estimate of the parameter when an unique value is available
