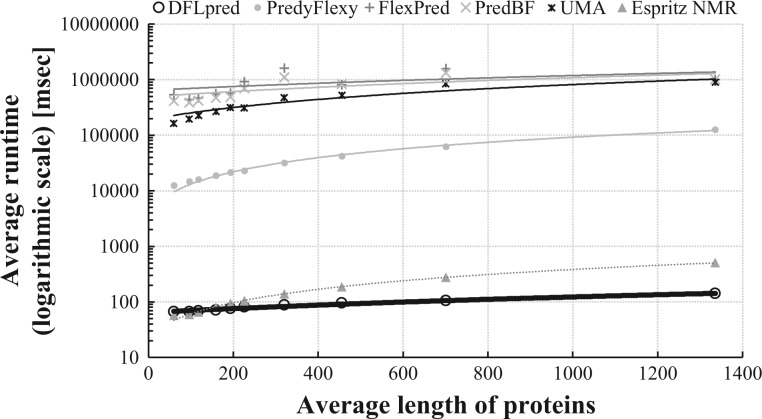
Fig. 5.
Comparison of runtime in the function of the length of the input protein sequences for UMA and all individual methods (except ThreaDom) that secured AUC > 0.5 based on the evaluations on the entire test dataset or separately for the inter- and intra-domain residues. The runtime is shown using base 10 logarithmic scale. Lines denote linear fits into the measured data that are shown using markers

