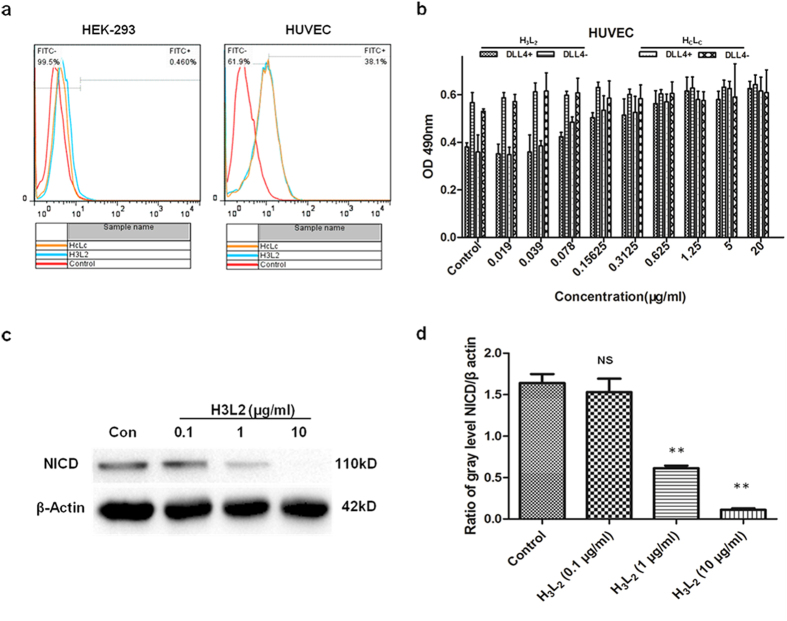
Figure 4. Effects of H3L2 on HUVEC cells.
(a) Binding capacity to HUVEC cells analyzed by Flow Cytometry. H3L2 and HCLC exhibited similar binding rates to HUVEC cells (36.9% and 38.1% respectively), and low binding to HEK-293 was observed (1.72% and 0.46% respectively). (b) H3L2 promoted HUVEC cells proliferation in a dose dependent manner. Cell proliferation were measured by MTT method and shown as absorbance units (mean ± SD, n = 3). (c,d) NICD levels in HUVEC cells detected by Western Blot. H3L2 inhibited Notch1 activation in a dose dependent manner. (d) Ratio of NICD and β actin gray levels. Gray levels were analyzed by Alpha Ease FCTM software, version 3.1.2. Data are given as the mean ± SD (n = 3). NS: no significance, **p ≤ 0.01 versus Control.

