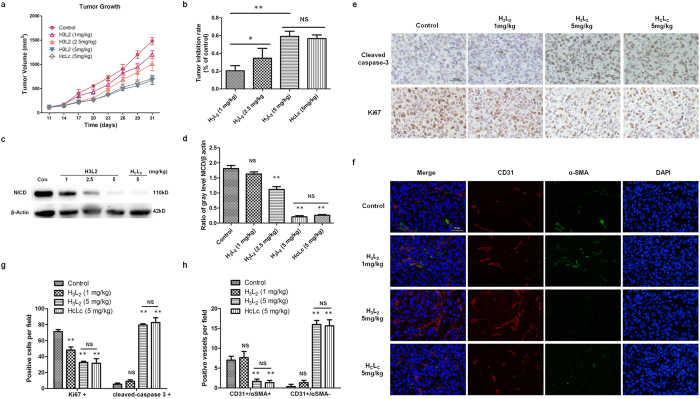
Figure 5. The in vivo anti-tumor activity of H3L2 in the MDA-MB-231 xenograft model.
(a) Tumor growth curves of nude mice in different groups. 30 nude mice were randomly divided into 5 groups for drug administration on the 11th day post tumor cell inoculation, tumor volumes of mice were measured with the mean ± SD, n = 6. (b) Tumor inhibition rates of different groups. Average tumor inhibition rates of each group were 19% (H3L2 1 mg/kg), 34% (H3L2 2.5 mg/kg), 59% (H3L2 5 mg/kg) and 56% (HCLC 5 mg/kg). Data are given as the mean ± SD (n = 6). (c) NICD levels in tumor cells analyzed by Western Blot. (d) Ratio of NICD and β actin gray levels. Gray levels were analyzed by Alpha Ease FCTM software, version 3.1.2. Data are given as the mean ± SD (n = 3). (e) Expression levels of Ki67, cleaved caspase-3 (brown staining) in tumors analyzed by IHC. Photomicrographs were taken at 400x magnifications. Scale bar = 50 μm. (g) Quantifications of Ki67 or cleaved caspase-3 positive cells per field. Data are given as the mean ± SD (n = 3). (f) Immunofluorescence double staining of CD31-positive (red fluorescence) and α-SMA-positive (green fluorescence) cells in tumors. Scale bar = 50 μm. (h) Quantifications of mature (CD31+/α SMA+) or immature (CD31+/α SMA−) vessels per field. Data are given as the mean ± SD (n = 3). *p ≤ 0.05, **p ≤ 0.01, NS: no significance.

