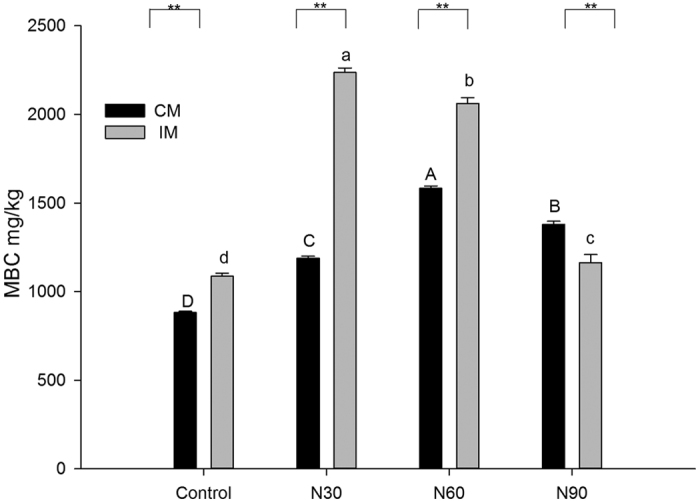
Figure 1. Soil microbial biomass carbon (MBC) contents under conventional management (CM) or intensive management (IM) and three N addition treatments.N30: 30 kg N∙ha−1∙yr−1; N60: 60 kg N∙ha−1∙yr−1; N90: 90 kg N∙ha−1∙yr−1.

Lowercase letters indicate significant differences between N addition treatments under IM(P < 0.05). Capital letters indicate significant differences between N addition treatments under CM (P < 0.05).Asterisks indicate significant differences between CM and IM at identical N addition rates (*P < 0.05, **P < 0.01). Values represent means of three replicates, and error bars indicate standard errors.
