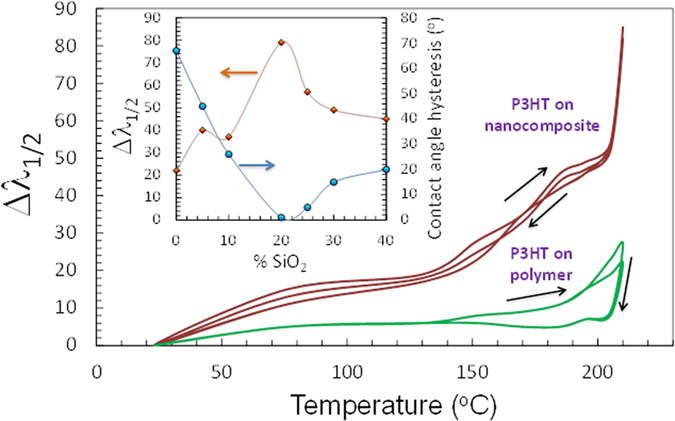
Figure 5. Changes in the spectra as a function of temperature traced by recording the changes in the wavelength corresponding to 45% reflection.

The shifts were denoted by ΔλR1/2 for every temperature step. The hysteresis is also shown by cooling down the heated surfaces for P3HT on the superhydrophobic surface and on the polymer coating alone. The inset shows the value of ΔλR1/2 and water contact angle hysteresis as a function of SiO2 nanoparticle concentration within the polymer matrix.
