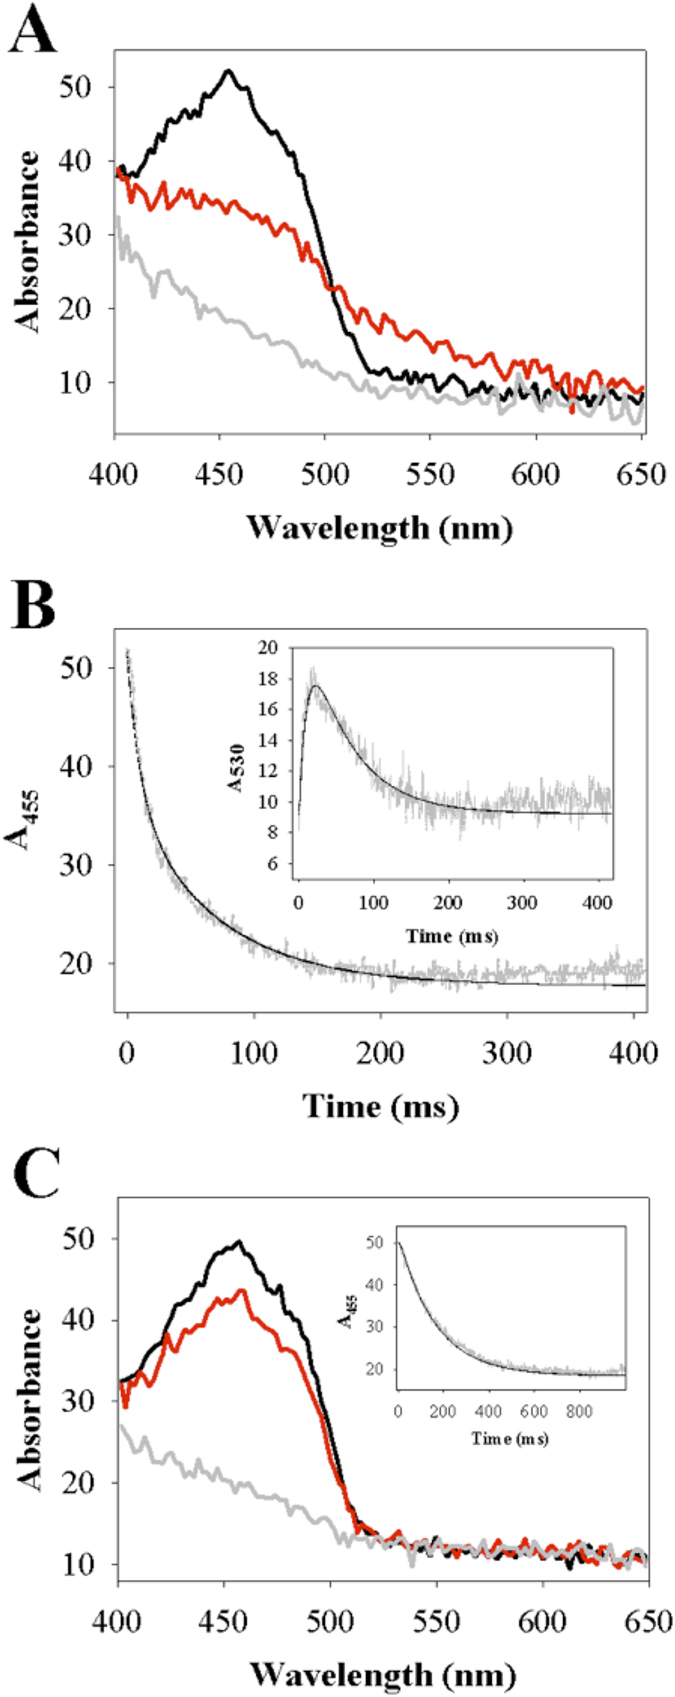
Figure 3.

Stopped-flow kinetic analysis of anaerobic reduction of lactate oxidase variants Y215F (A,B) and Y215H (C) by L-lactate at 20 °C and pH 6.5 is shown. A) A superpositioning of wavelength scans of oxidized Y215F (4.3 μM) before (black line) and after 20 ms (red line) and 200 ms (grey line) of reaction with 10 mM L-lactate. The spectra show decrease in absorbance at 455 nm reflecting the FMN reduction but also intermittent increase in absorbance at around 530 nm reflecting accumulation of reduced enzyme-pyruvate complex. After reaction for 200 ms, absorbance at both 455 nm and 530 nm is lost, indicating that the enzyme was completely reduced and also the reduced enzyme-pyruvate complex was dissociated. B) A comparison of time traces of FMN reduction at 455 nm and reduced enzyme-pyruvate complex formation at 530 nm (inset). Experimental measurements are shown in grey and fits of the data are shown as black lines. The trace at 455 nm was fitted with a double exponential, the trace at 530 nm was described by a combined kinetic simulation and fitting using Fig. 1, which is described in the Discussion. C) A superpositioning of wavelength scans of oxidized Y215H (4.3 μM) before (black line) and after 20 ms (red line) and 500 ms (grey line) of reaction with 10 mM L-lactate. The spectra show decrease in absorbance at 455 nm to yield completely reduced enzyme, yet there is no intermittent increase in absorbance at around 530 nm. The inset shows a time trace of aborbance at 455 nm. Experimental data are shown in grey and a single exponential fit is shown as black line.
