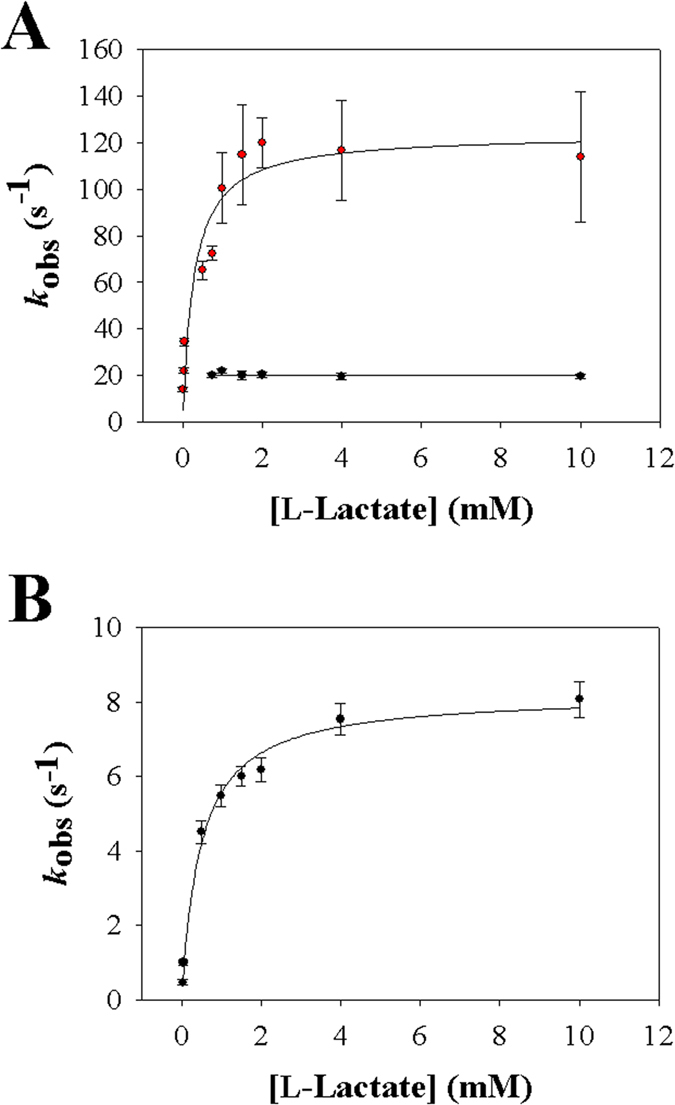
Figure 4.

Analysis of stopped-flow rate constants of anaerobic reduction of lactate oxidase variants Y215F (A) and Y215H (B) by L-lactate at 20 °C and pH 6.5. A) The dependence of the rate constant of the fast FMN reduction phase (red symbols) on the L-lactate concentration. The black line is a hyperbolic fit of the data, yielding kred and Kd. The rate constant of the second (slow) phase of absorbance decay at 455 nm is shown in black symbols. It is independent of the L-lactate concentration and the line shows the constant (average) value. Note: the lowest L-lactate concentration at which the slow phase could be distinguished from the fast phase was around 0.75 mM. The line therefore stops at this concentration. B) The dependency of the rate constant of the single FMN reduction phase (black symbols) on the L-lactate concentration is shown. The black line is a hyperbolic fit of the data, yielding kred and Kd. Error bars show the S.D. from three or more independent determinations.
