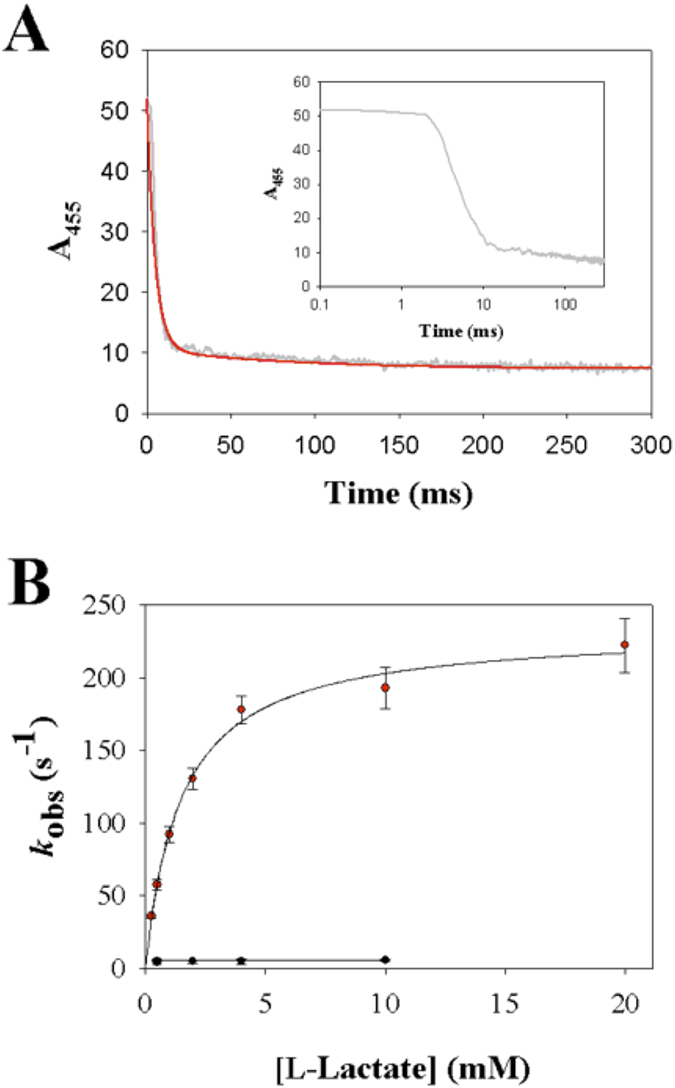
Figure 5. Stopped-flow kinetic analysis of anaerobic reduction of wild-type lactate oxidase by L-lactate at 20 °C and pH 9.5 is shown.

In panel A is shown a time trace of absorbance at 455 nm on reaction of the enzyme (4.5 μM) with 10 mM L-lactate. The trace is biphasic where a fast phase in which about 90% of total absorbance change occurs (≤15 ms) is followed by a much slower phase of absorbance decrease. Measurements are shown in grey and double exponential fit of the data is shown in red. The inset shows a logarithmic plot of the data. In panel B is shown the analysis of the dependence of the stopped-flow rate constants on the L-lactate concentration. The rate constant of the second slow phase of absorbance decay was independent of the L-lactate concentration.
