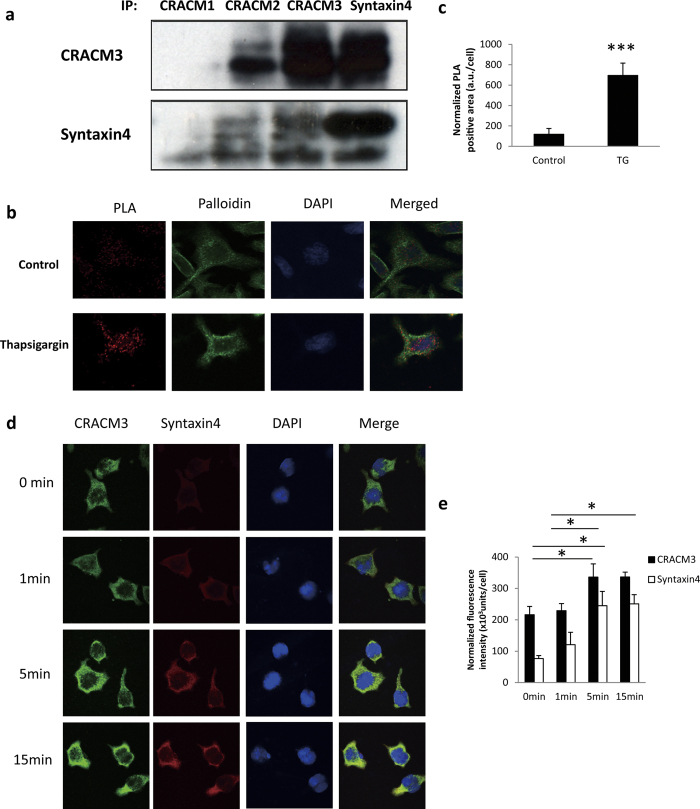
Figure 1. Molecular interaction of syntaxin4 and CRACM3 in RBL-2H3 cells.
(a) CRACM3 and syntaxin4 protein levels were measured by western blotting after immunoprecipitation using specific antibodies for CRACM1, CRACM2, CRACM3, and syntaxin4. Full-length blots are presented in Supplementary Fig. 1. Upper: expression of CRACM3 in TG-stimulated cells (lane 1–4). Lower: expression of syntaxin4 in TG-stimulated cells (lane 1–4). (b) In situ PLA assay in non-stimulated cell and TG-stimulated cells. TG-stimulated or non-stimulated RBL-2H3 cells were used for in situ PLA analysis using a Duolink In Situ Detection Reagents Far Red detection kit. The slides were examined by confocal microscopy. The imaging data were analysed with Duolink ImageTool. Upper: Red PLA fluorescence signal, phalloidin green fluorescence signal, DAPI fluorescence signal and merged image in non-stimulated control cells. Lower: Red PLA fluorescence signal, phalloidin green fluorescence signal, DAPI fluorescence signal and merged image in TG-stimulated control cells. (c) Positive PLA area in non-stimulated and TG-stimulated cells normalized to DAPI fluorescence (n = 42, ***P < 0.001). (d) The expression of CRACM3 and syntaxin4 at 0 min, 1 min, 5 min, 15 min in TG-stimulated cells detected by confocal microscopy. (e) Normalized fluorescence signals of CRACM3 and syntaxin4 using DAPI fluorescence (n = 40, *P < 0.05). Cells were examined by confocal microscopy, and imaging data were analysed with ImageJ software.

