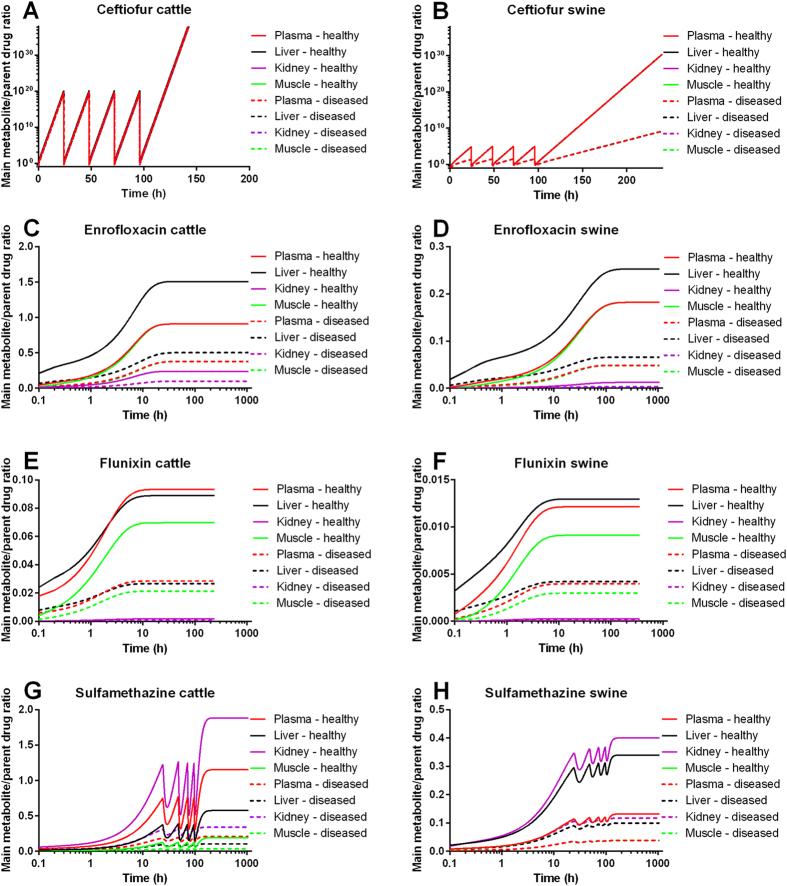
Figure 3. Effect of disease on the main metabolite to parent drug (M/D) ratio.
Healthy and diseased cattle and swine were assumed to be exposed to labeled therapeutic regimens of ceftiofur (A,B), enrofloxacin (C,D), flunixin (E,F), and sulfamethazine (G,H). The M/D ratios of studied drugs in the plasma and tissues of cattle and swine were predicted using the PBPK model. The labeled therapeutic regimens of these drugs are shown in Supplementary Table 9.

