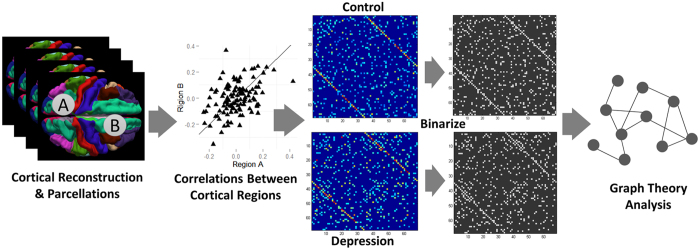
Figure 5. Schematic for construction of cortical thickness covariance networks and analysis workflow (left to right).
The whole cerebral cortex was parcellated into 34 ROIs per hemisphere. Thickness was calculated after removing nuisance variables, and then correlation of all possible thickness pairs computed (total of 2278), and displayed as a correlation graph (minimal density of two fully connected graphs with weak correlations removed). Graphs were thresholded at a set density (0.12–0.4, 0.02 interval) for graph-theoretical analysis.

