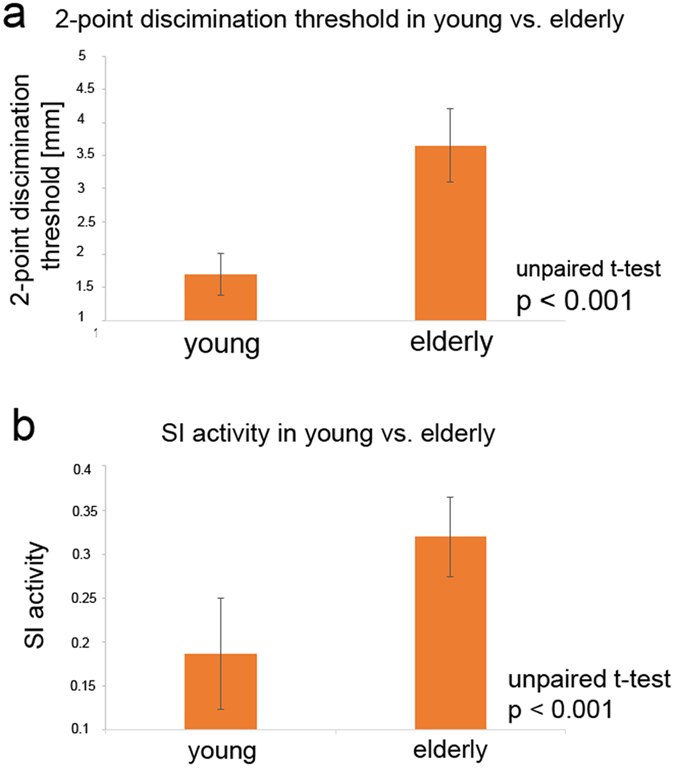
Figure 1. Discrimination thresholds and SI activity in young and elderly participants.

Bars indicate the mean and whiskers the standard error. (a) The two-sample t-test revealed a significant decline in discrimination acuity in the group of elderly participants. (b) SI activity contralateral to the right index finger was significantly higher in elderly as compared to young participants. SI activity was obtained from the SPM one-sample t-test at p = 0.05 (family-wise error corrected) across young and elderly subjects (n = 40) at −30, −34, 62 mm (MNI coordinates), (i.e., same voxels for young and elderly participants), T-value of 5.86 (see Material and methods for further information).
