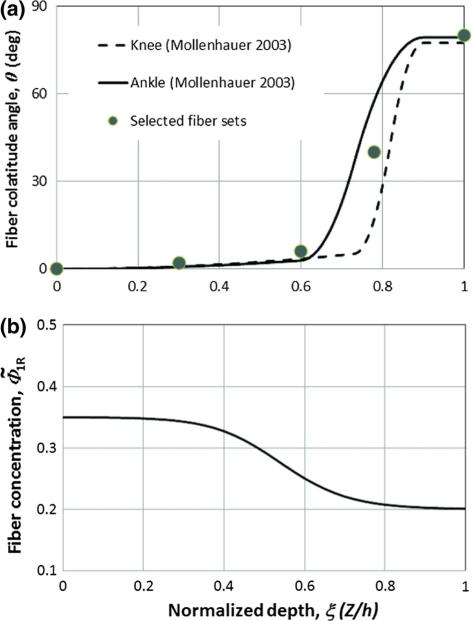
Fig. 2.
The fiber orientation and volumetric concentration as a function of cartilage depth. a The fiber orientation for representative human ankle and knee cartilage layers [28]. From the deep zone (ξ =0) to the superficial zone (ξ = 1.0), the fiber orientation varies from nearly vertical to the contact surface (approximately 0°) to nearly parallel to the contact surface (approximately 80°). A set of five fiber orientations (symbols) are selected to represent the test data. b Fiber volumetric fraction with respect to the solid, , as a function of cartilage depth (constructed based on experimental data [5,36])

