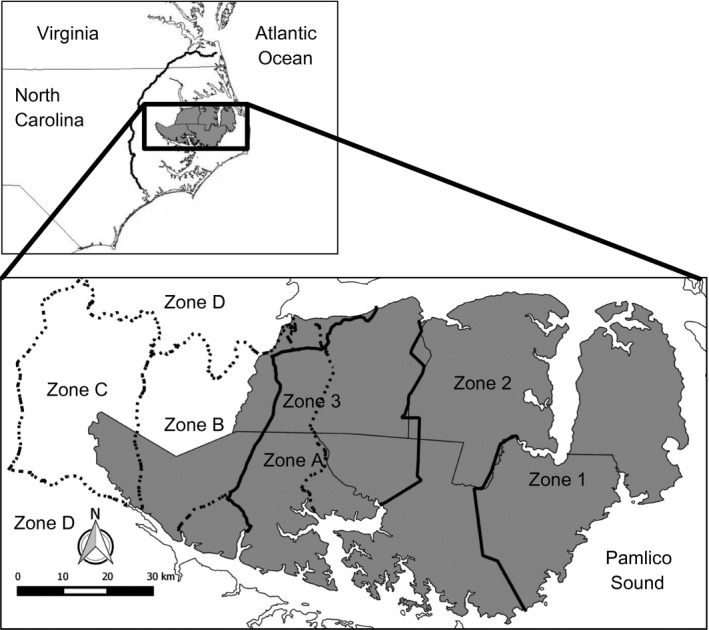
Figure 1.

Map of the Red Wolf Experimental Population Area (RWEPA) and the associated study design. The areas shaded in gray represent the five counties that compose the RWEPA, and the solid black lines are the boundaries of the three management zones. The dashed lines indicate the boundaries of the sampling zones designated for the 2010 scat survey. Note that the western boundaries of Zone 3 and Zone A overlap for most of their lengths. The inset is a map of eastern North Carolina and the RWEPA. The solid black line in the inset indicates the western boundary of the 2008 scat survey (Zone D).
