
Figure 3.
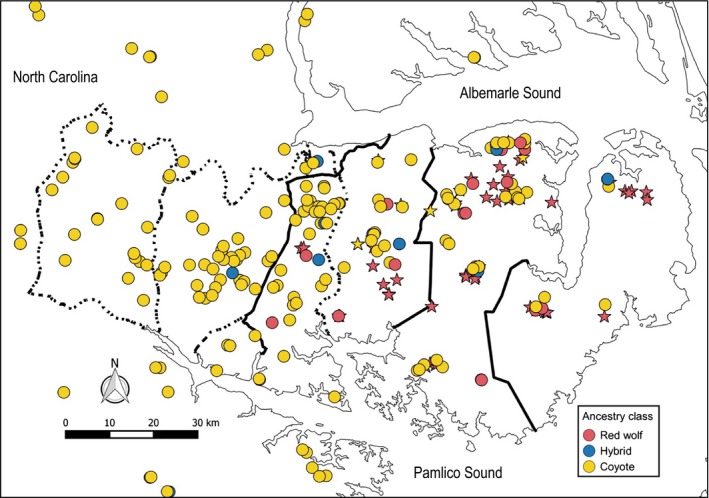
Distribution of individuals detected across the study area and their associated amount of red wolf ancestry. Each point represents a different individual, and each color reflects its classification based on red wolf ancestry. Stars represent individuals that had previously been captured and genotyped; circles denote new individuals identified via NIS. ‘Red wolf’ refers to individuals with a STRUCTURE q‐value great than 0.875 for the red wolf cluster; ‘Hybrid’ between 0.125 and 0.875; ‘Coyote’ less than 0.125. The solid black lines are the boundaries of the three management zones, and the dashed lines indicate the boundaries of the sampling zones designated for the 2010 scat survey. Note that this map does not cover the entire extent of Zone D: only individuals that fit within this frame are represented on the map.