
Figure 4.
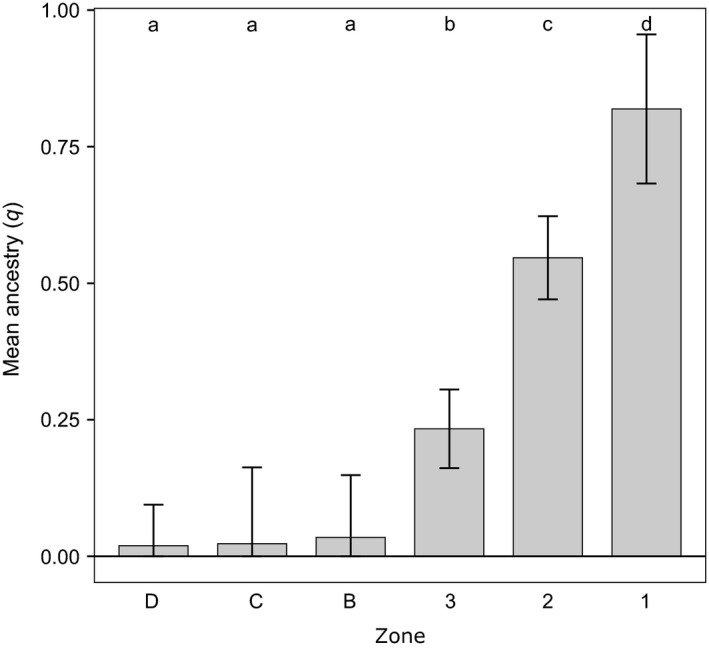
Average level of red wolf ancestry for each geographic zone. These values were determined by averaging the amount of red wolf ancestry across all individuals detected in each zone. Each value is surrounded by its corrected 95% confidence interval. Lower case letters indicate groups of zones that could not differentiated using the Fisher's LSD test. Note that the distribution of the zones on this graph follows geographic distribution across this system with Zone D as the western most zone and Zone 1 as the eastern most. The distance between the zones on the x‐axis does not reflect their actual geographic distance. Note that sampling Zones 3 and A were combined for this analysis due to substantial spatial overlap.