
Figure 2.
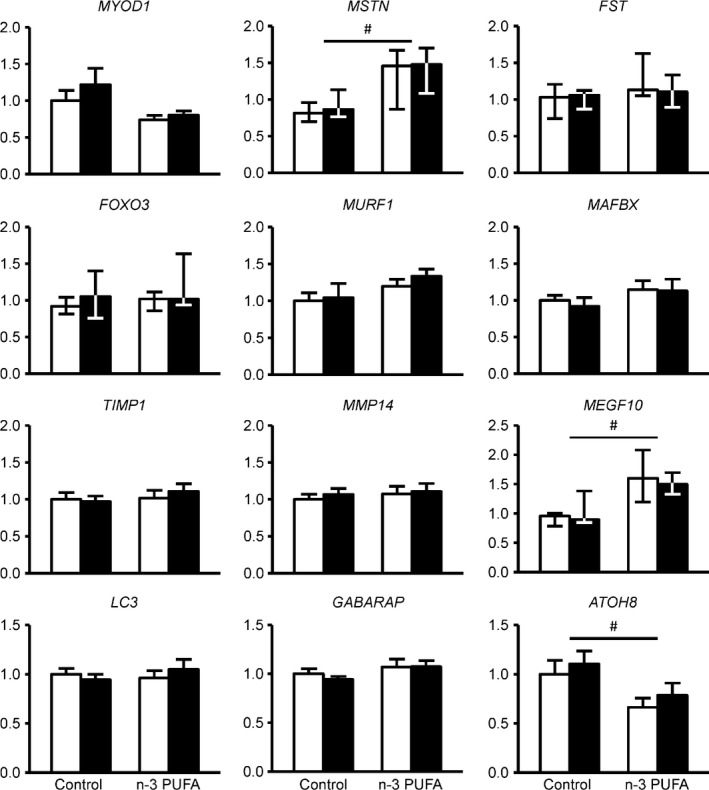
Skeletal muscle gene expression of key regulators of hypertrophy, atrophy, regeneration, and autophagy. Expression of individual genes involved muscle hypertrophy, regeneration, atrophy, and autophagy was determined by quantitative RT‐PCR before (white bars) and after (black bars) corn oil or n‐3 PUFA treatment (n = 10 per group). The expression of genes of interest was normalized to the expression of RPLP0. MYOD1,MURF1,MAFBX,TIMP1,MMP14,LC3, and GABARAP are presented as mean ± SEM;MSTN,FST,FOXO3, and MEGF10 are presented as median ± quartiles. # ANOVA revealed a significant main effect of group (P < 0.05). MYOD1, myogenic differentiation 1; MSTN, myostatin; FST, follistatin; FOXO3, forkhead box O3; MURF1, muscle‐specific RING finger‐1; MAFBX, muscle atrophy F‐box; TIMP1, TIMP metallopeptidase inhibitor 1; MMP14, matrix metallopeptidase 14; MEGF10, multiple EGF‐like‐domains 10; LC3, microtubule‐associated protein 1 light chain 3 alpha; GABARAP, GABA(A) receptor‐associated protein; ATOH8, atonal homolog 8 (Drosophila).