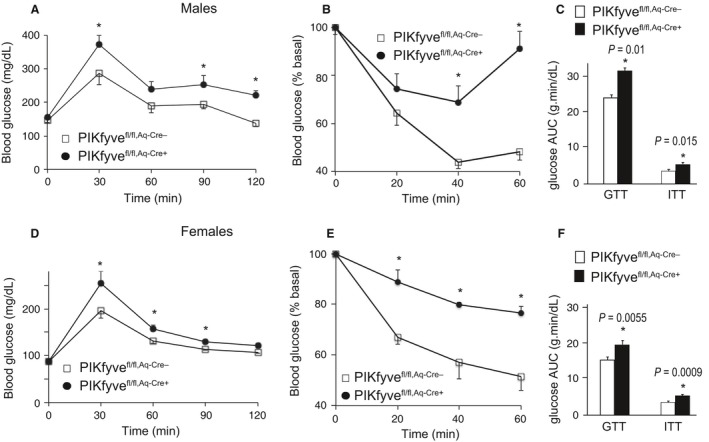
Figure 4.

Systemic glucose intolerance and insulin resistance in both PIKfyvefl/fl,Aq‐Cre+ males and females. (A, B, D, and E): Blood glucose levels were measured at indicated time points before and after 1.5 g/kg of glucose (A and D) or 0.75 U/kg of insulin (B and E), administered i.p. in 24–26‐week‐old male (n = 10–12/group) and female mice (n = 6–8/group); *P < 0.05 versus controls. (C and F): The area under the glucose curves (AUC) during GTT and ITT, showing significant (P values are denoted) insulin resistance in both male and female PIKfyvefl/fl,Aq‐Cre+ mice.
