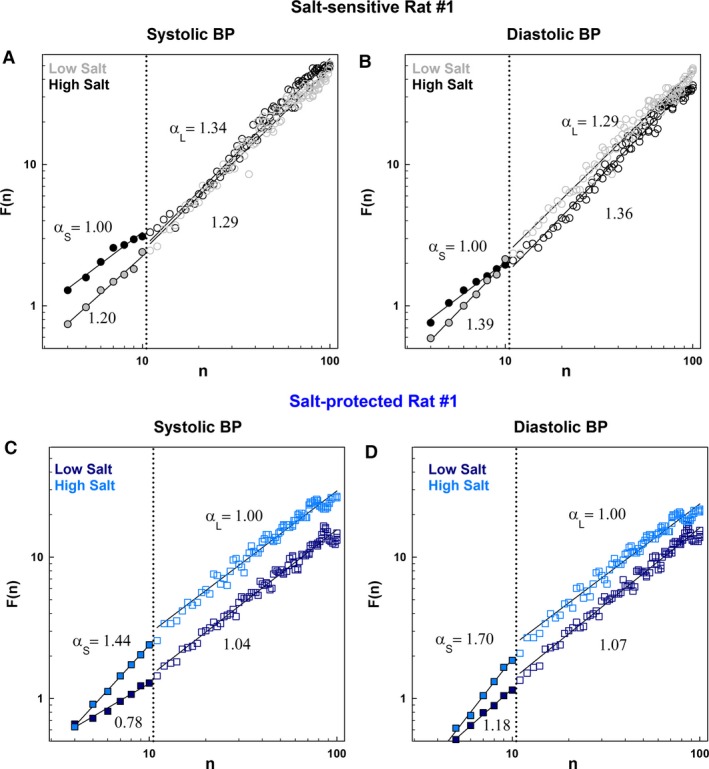
Figure 2.

Log–log plot of DFA‐derived F(n) versus n derived for systolic and diastolic BP time series datasets shown in Figure 1, for example, salt‐sensitive and ‐protected rats while on low‐salt diet compared to high‐salt diet: (A) SBP, salt‐sensitive rat; (B) DBP, same salt‐sensitive rat; (C) SBP, protected rat; and (D) DBP, same protected rat. Log–log plots of all rats are shown in Figures S1–S4.
