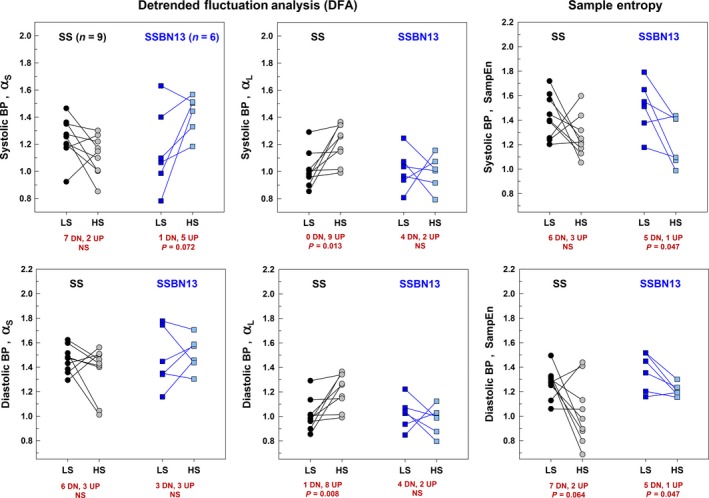
Figure 3.

Effect of high‐salt (HS) diet following low‐salt (LS) diet on entropy and detrended fluctuation properties of the systolic and diastolic BP time series shown for all study salt‐sensitive (n = 9) and ‐protected (n = 6) rats individually: (A) α S of SBP; (B) α L of SBP; (C) SampEn of SBP; (D) α S of DBP; (E) α L of DBP; and (F) SampEn of DBP. Comparisons were done using the paired t test and the signed‐rank test as appropriate.
