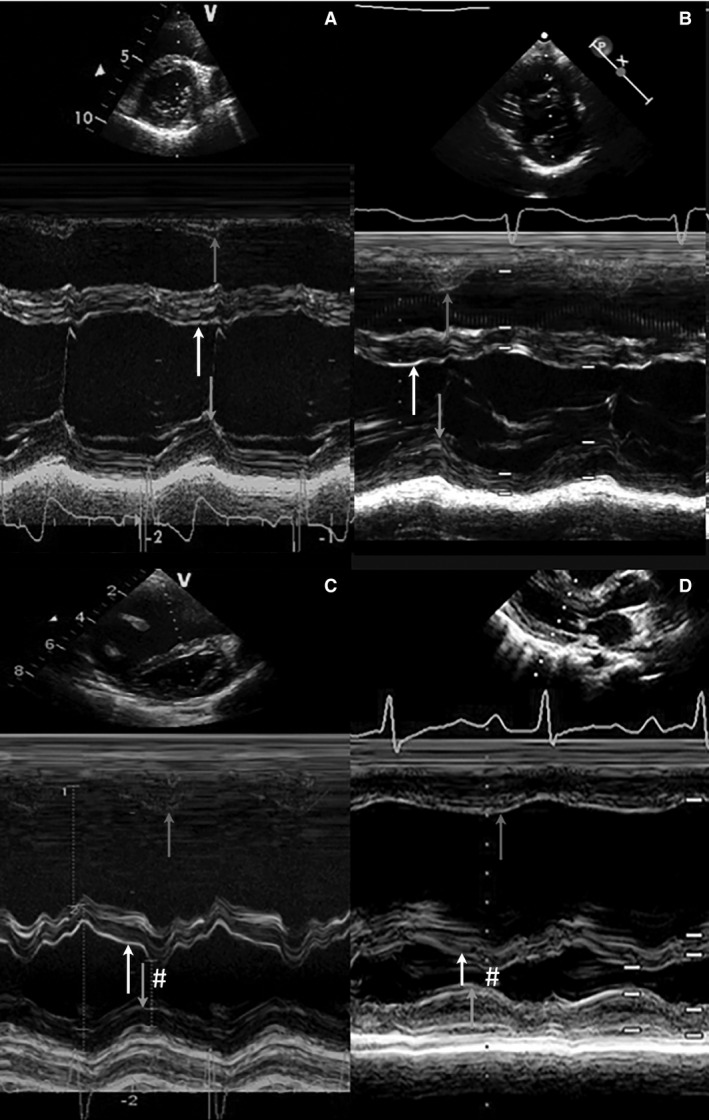
Figure 1.

M‐mode cross sections. Four representative examples of m‐mode cross‐sectional parasternal short or long axis at the level of MV annulus are shown. The time to peak radial motion of right ventricular free wall, septum, and left ventricular posterior wall are depicted with arrows. (A) control, (B) pulmonary stenosis and (C and D) idiopathic pulmonary arterial hypertension. Abnormal septal motion in iPAH patients at the beginning of LV diastole is marked with # (C and D).
