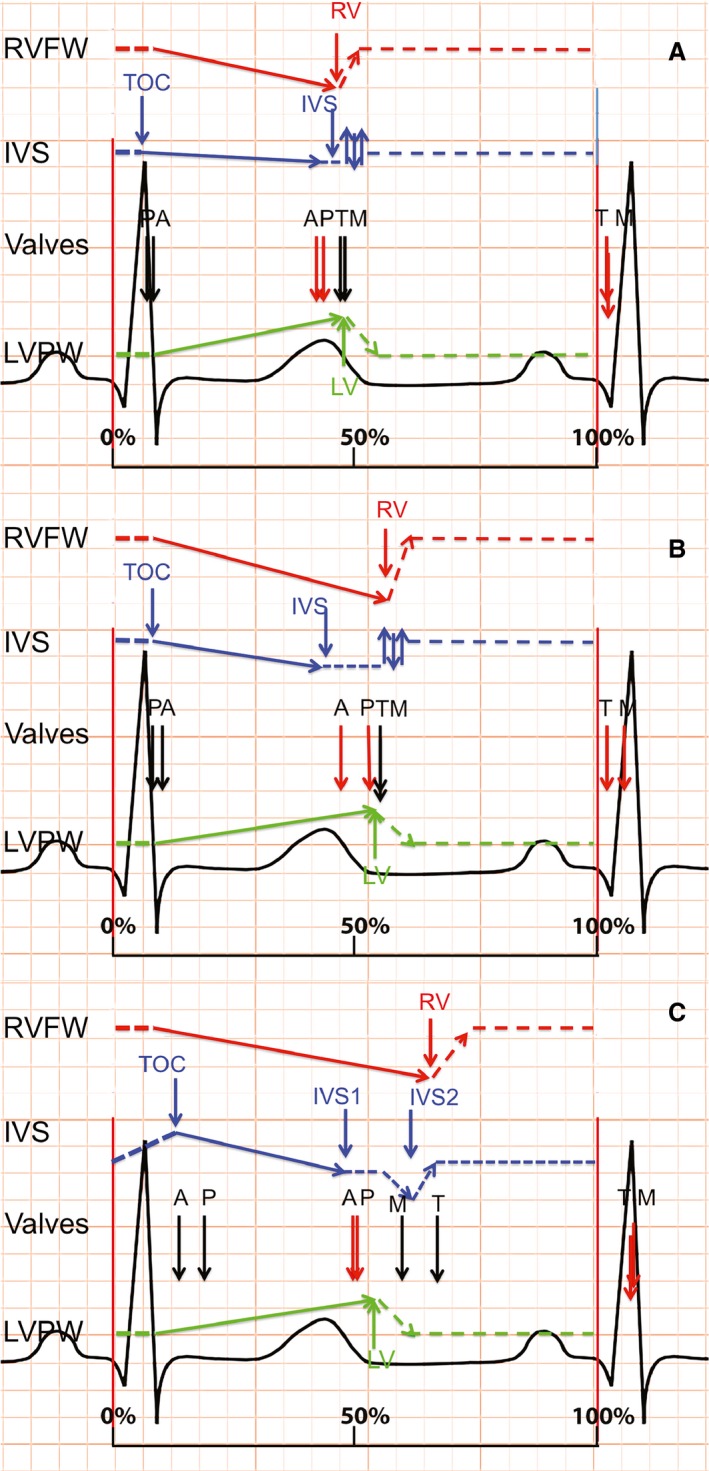
Figure 2.

Schematic representation of cardiac events. Schematic representation of peak contraction and valve timing (opening in black and closure in red), relative to RR interval, for each group. A = controls; B = pulmonary stenosis; C = idiopathic pulmonary arterial hypertension. TOC, time of onset contraction; IVS, interventricular septum; LV, left ventricular free wall; RV, right ventricular free wall; A, aortic valve; P, pulmonic valve; M, mitral valve; T, tricuspid valve.
