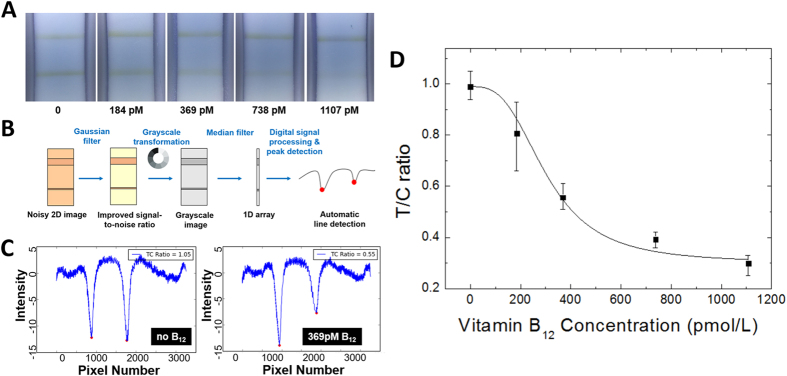
Figure 3. NutriPhone image acquisition and processing for vitamin B12 quantification.
(A) Colorimetric variation of the test and control line regions on the silver enhanced B12 lateral flow test strip at different known concentrations of standard vitamin B12 samples (B) image processing algorithm used by our NutriPhone platform (C) Test and control line signals detected by the NutriPhone app as local intensity minima for 0 and 369 pmol/L of B12 standard samples (D) Calibration curve showing the T/C ratios of the colorimetric signals at different standard B12 concentrations: T/C ratio = d + (a–d)/(1+([B12]/c)^b), where a = 0.99, b = 3, c = 303.7, and d = 0.3. Four parameter curve was fitted with R2 = 0.8776. At each concentration 3 strips were used and the maximum and minimum deviation from the average were shown as error bars.

