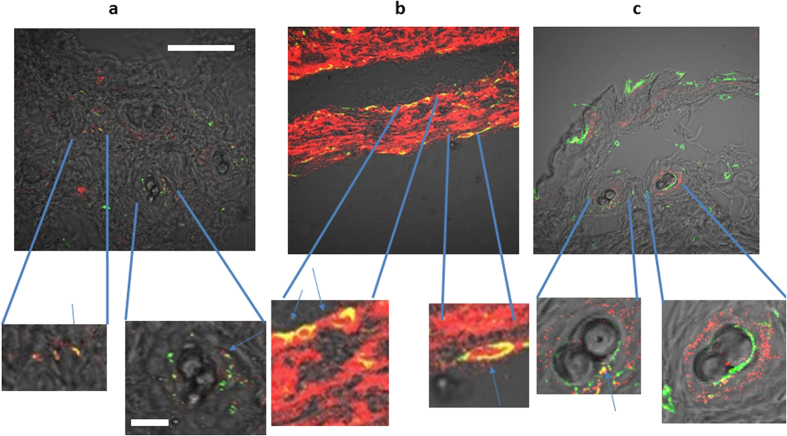
Figure 4. Co-staining for OCT-4 (red) & Vimentin (green) in tumor tissues.
10x bright field images with crop-outs are subsets of the original 10X images. (a) Co-staining of BxPC-3 tumor tissue (b) Staining of MDA-MB-231 tumor tissue (c) Staining of EMT-6 tumor Yellow indicates areas of co-localization. Scale bar represents 500  for the low magnification image, and 100
  m for magnified regions.

