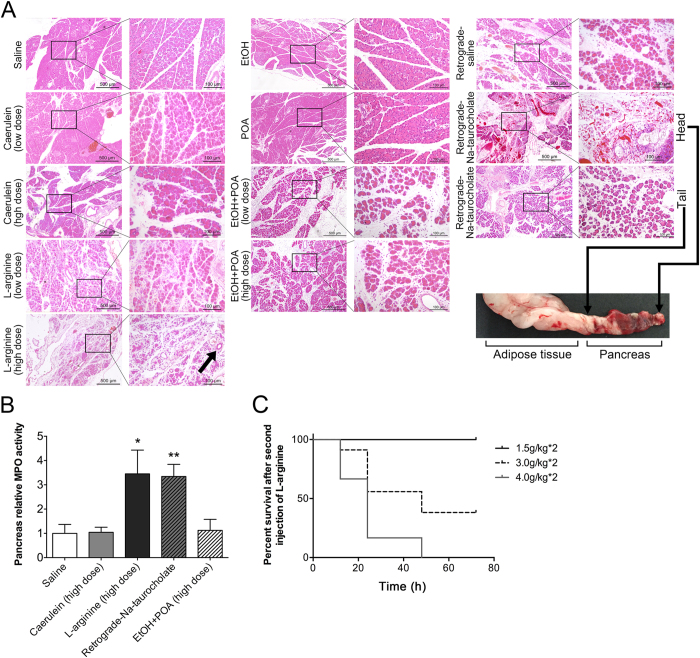
Figure 3. Representative pathological changes in pancreatitis induced by caerulein, L-arginine, Na-taurocholate and ethanol (EtOH) + POA respectively.
(A) HE stained sections of pancreas in magnification 50X or 200X. The arrow on left panel shows vacuolization in pancreas tissue from L-arginine-induced model, and arrows on right panel indicate the head and the tail of pancreas from Na-taurocholate-induced model, respectively. (B) Relative MPO activity of pancreatic tissue in 4 different pancreatitis models. *p < 0.05 and **p < 0.01 were obtained in comparison to the saline group for n = 8 in each group. (C) Survival curve after L-arginine injection.

