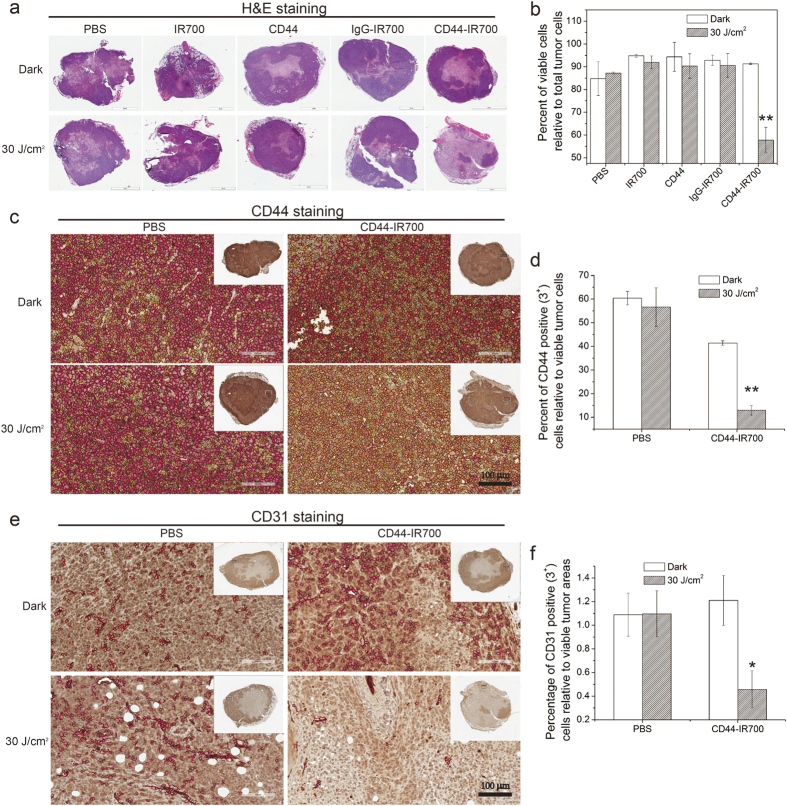
Figure 6. H&E and IHC characterization of tumors for necrosis, CD44 and CD31.
(a) Representative images of tumor sections after H&E staining. Nude mice bearing bilateral MDA-MB-231 tumors received a single injection of 100 μg of immunoconjugates/controls with or without irradiation at 24-h p.i., and tumors were excised at 4 days p.i. (n = 3 per group). (b) Quantitative analysis of viable cells in tumor sections from H&E stained images. Representative images of tumor sections after CD44 (c) or CD31 (e) immunostaining and the corresponding quantitative analysis of the percentage of CD44 positive (3+) cells relative to the viable tumor cells (d) and the percentage of CD31 positive (3+) vasculature cells relative to the viable tumor area (f). Values represent means ± SD (n = 3 per group, *P < 0.05, **P < 0.01 for the tumor slices from CD44-IR700-injected NIR-irradiated mice compared to non-irradiated control groups using Student’s t test). In (c,e), red, orange and yellow circles mark 3+, 2+ and 1+ positive cells, respectively. Scale bars indicate 100 μm.

