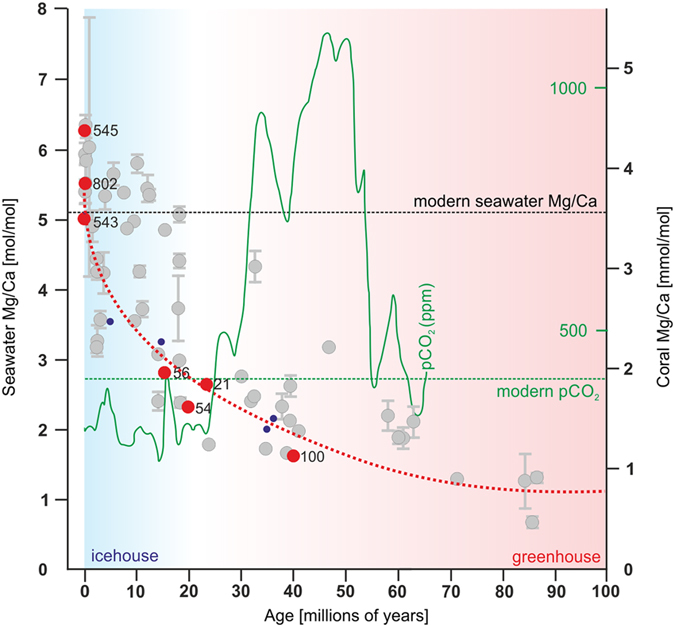
Figure 6. Evolutionary continuity of shingle-like biomineralization pattern in Acropora lineage across geochemical gradients.

Seawater Mg/Ca composition during last 100 Ma inferred from diverse well preserved fossil corals (grey circles) following Gothman et al.29. Red circles represent Mg/Ca of seawater inferred from extant (ZPAL H.25/12(545), ZPAL H.25/86(802), ZPAL H.25/80(543A)) and best preserved aragonite fossil Acropora samples (C-SCL-56, ZPAL H.27/23(C54), ZPAL H.27/20(C21), ZPAL H.27/18(C100)). Red, dashed line is the seawater Mg/Ca reconstruction based on halite fluid inclusions (blue dots)32. Conventionally Mg/Ca of 2 was considered a boundary between aragonite and calcite precipitation (aragonite/calcite seas) but recent experiments40 show that there is a gradual and temperature-dependent shift in calcium carbonate polymorph proportions. Green curve indicates estimates of atmospheric CO2 reconstructed from terrestrial and marine proxies41. Horizontal dashed green line indicates the present-day atmospheric CO2 concentration (ca. 400 ppm).
