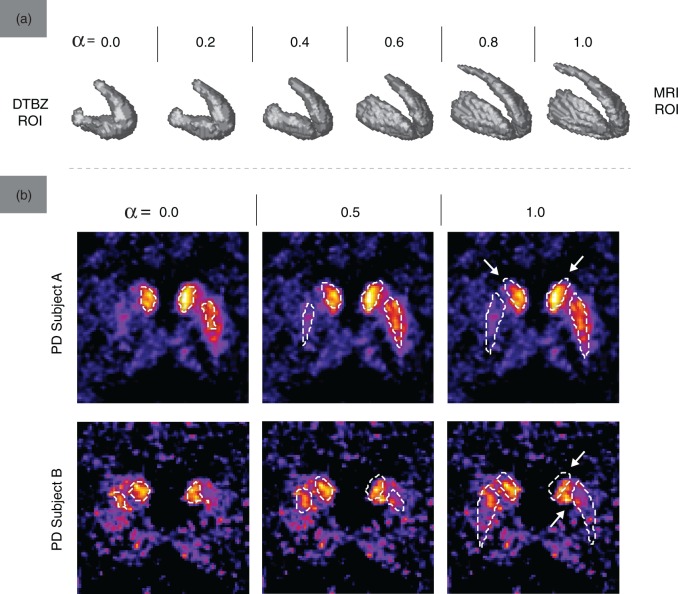
Figure 2.
(a) The shape of for one of PD subjects (UPDRS 9.0, DD 6, moderate severity) in the DTBZ-MRI ROI space. (b) Contours of overlaid on the transaxial slices of DTBZ BPND images, for two representative PD subjects and three values of α. Arrows point out areas of misalignment between and regions of high activity concentration.

