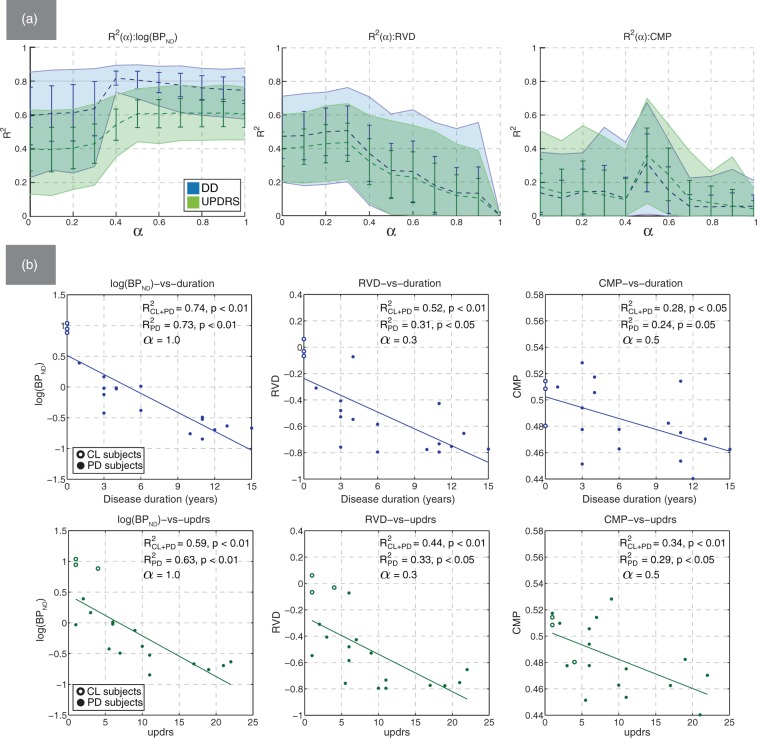
Figure 4.
(a) Mean bootstrapped values of R2 with standard deviation (error bars) and 95% confidence intervals (filled regions), plotted against α for BPND (left), RVD (middle), and CMP (right). The correlation with DD (blue) and UPDRS (green) was evaluated using putamen mixed ROIs; (b) representative scatter plots of log(BPND), RVD, and CMP against DD and UPDRS. Non-bootstrapped values of R2 are shown for the cases with the control subjects were included (CL + PD) and excluded (PD) from the analysis.

