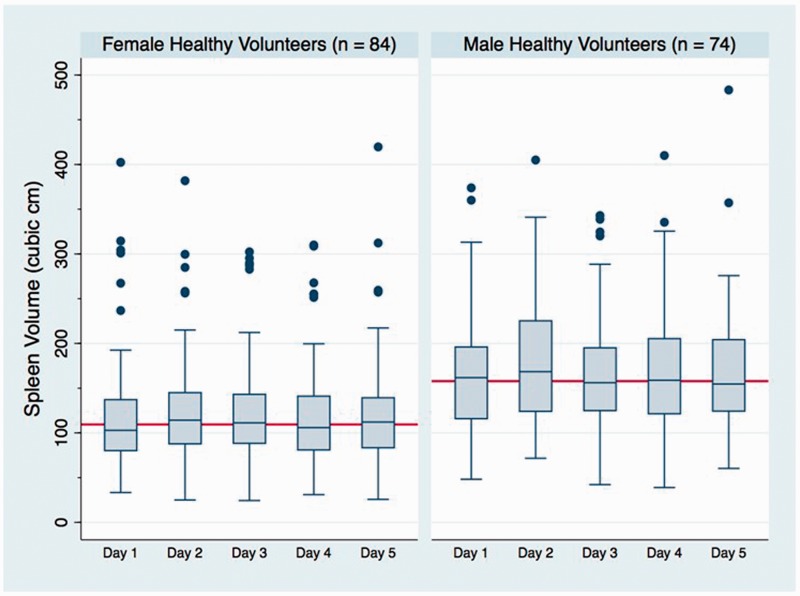
Figure 3.
Box and Whisker plot for spleen volumes of female and male healthy volunteers at five sequential days of observation. Each box represents the median with 25th and 75th percentile. The bars at the end of whiskers represent upper and lower adjacent lines. Adjacent line distance has been calculated as h-spread ± 2 steps, where h-spread is the difference between 25th and 75th percentile and step is 1.5 × h-spread. One outlier observation greater than 500 cm3 has not been shown to maintain proportional graphical scale, though all values were used for calculation. The solid red line in each sub-graph represents the overall median volume for females and males, respectively.

