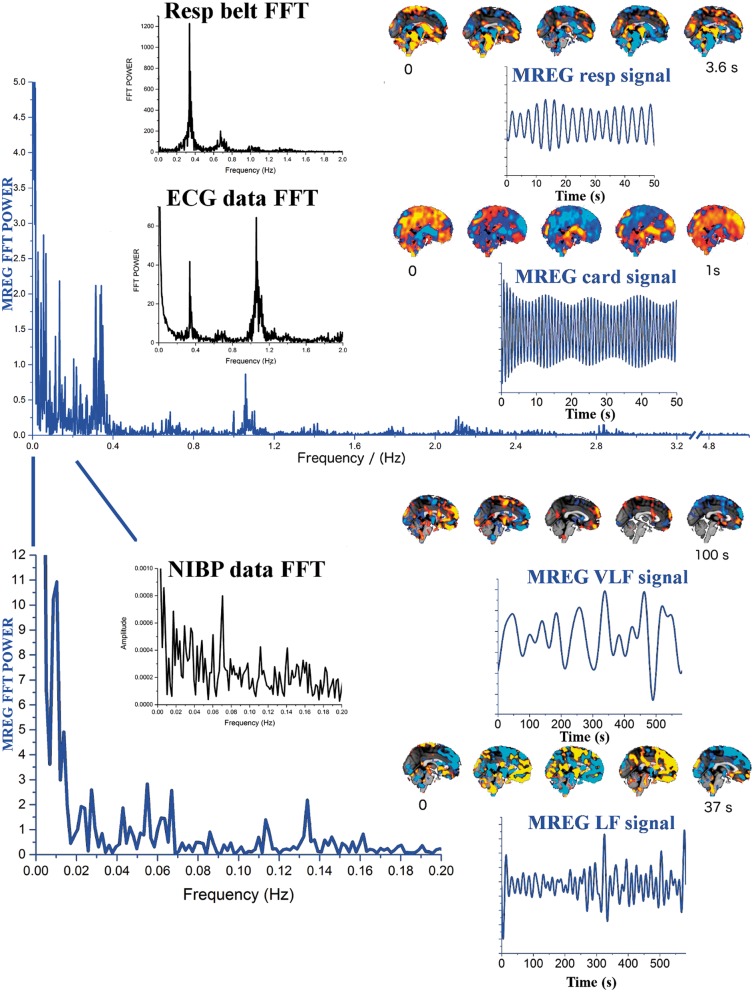
Figure 2.
Illustrates two blue MREG Fast Fourier Transform (FFT) power spectra of a ventromedial DMNvmpf MREG time signal after PICA-dual regression. The upper presents power till 5 Hz (cut-off 3.2–4.8 Hz) and below between 0–0.2 Hz. Respiratory frequency clusters around 0.37 Hz and cardiac frequency peaks at 1.08 Hz in MREG data, which are identical to pneumatic respiratory monitoring belt and FFT power spectra of ECG data shown in black. The cardiorespiratory pulsations have harmonic peaks at higher frequencies both in MREG and physiological verification data. VLF (0.01–0.027 Hz) and LF (0.027–0.73 Hz) bands present highest power peaks in the spectrum. NIBP data are shown to illustrate VLF/LF spectral power of the mean arterial blood pressure waves. The filtered MREG time domain signals are presented (blue), cardiorespiratory signals with 10 × shorter window than the VLF/LF signals. Individual QPPmaps are presented next to corresponding physiological signals.

