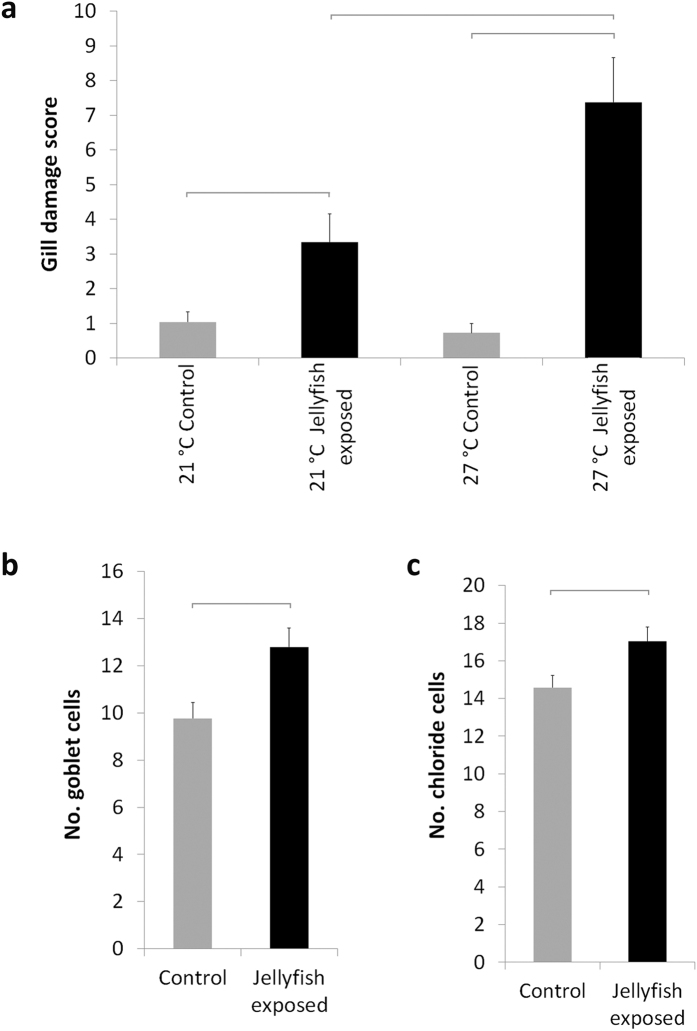
Figure 2.
Gill damage scores (10-point scale) for each treatment (a), numbers of goblet cells (b) and chloride cells (c). Fish exposed to jellyfish (black bars) and control fish (grey bars). Horizontal grey lines indicate significant differences among treatments (p < 0.05), based on Kruskal-Wallis test for gill damage scoring and one-way ANOVAs for goblet and chloride cells.

