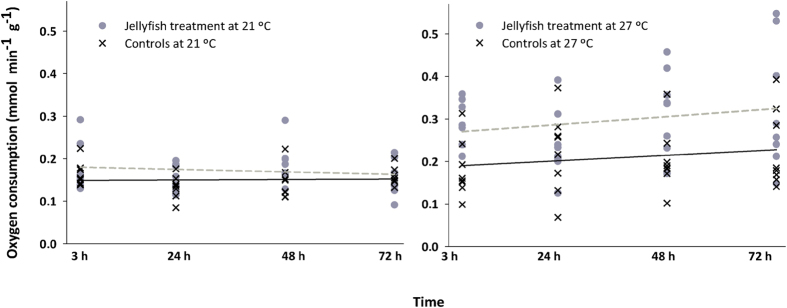
Figure 3. Oxygen consumption rates of Dicentrarchus labrax juveniles exposed to Pelagia noctiluca contact.
Fish exposed to jellyfish are represented by grey dots and a dashed regression line; control fish are represented by black “x” and a continuous regression line. Experiments performed at 21 °C and 27 °C are shown on the left and right panels, respectively. X axes correspond to the time after the fish were exposed to jellyfish. Overall, oxygen consumption rates did not change over time: r2 is 0.02 for treated and 0.002 for controls at 21 °C (n.s.) and 0.04 for treated and 0.03 for controls at 27 °C (n.s.). Regression lines have equal intercepts at 21 °C; however, treated fish have higher oxygen consumption rates than controls at 27 °C; see Table 4 for significances.

