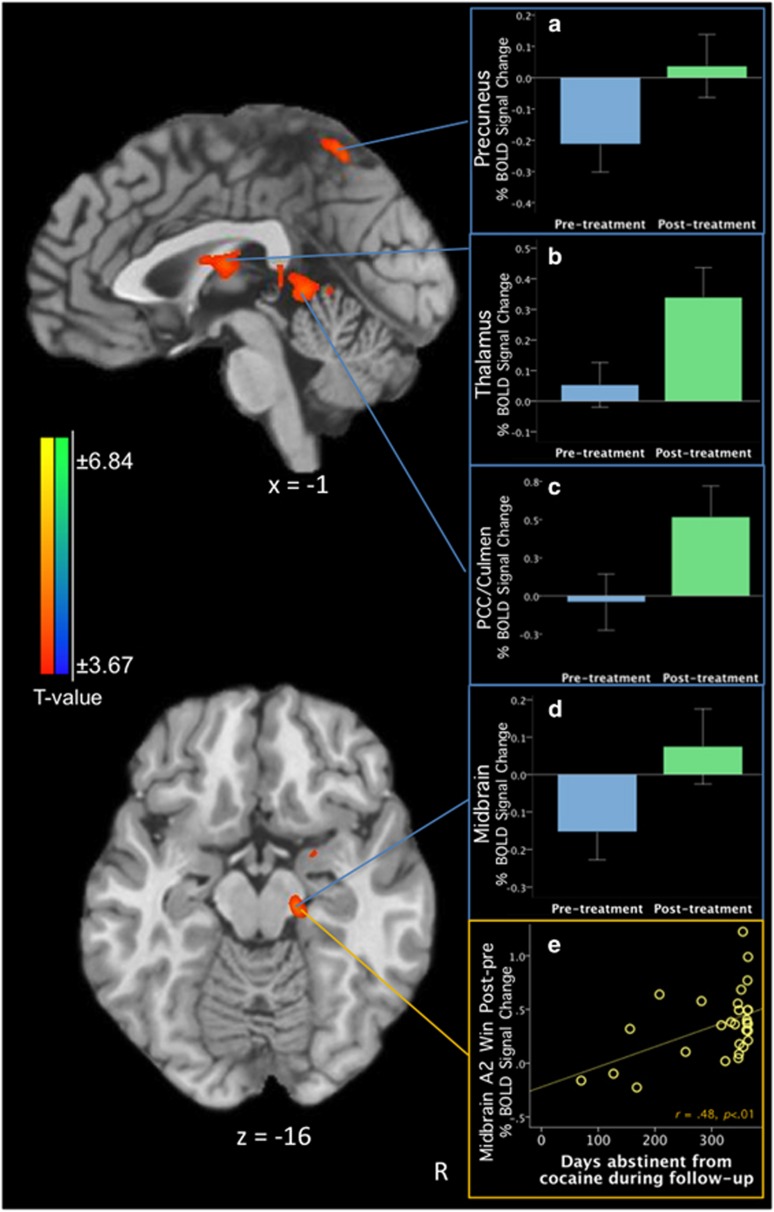
Figure 1.
Posttreatment–pretreatment differences on the Monetary Incentive Delay Task in the cocaine-dependent (CD) group (n=29) during the A2 winning phase (A2W, associated with the anticipation of potentially winning money). (a) The percentage of blood-oxygen-level-dependent (BOLD) signal change in the precuneus cluster during pretreatment and posttreatment; (b) BOLD signal change in the thalamus cluster during pretreatment and posttreatment; (c) BOLD signal change in the posterior cingulate (PCC)/culmen cluster during pretreatment and posttreatment; (d) BOLD signal change in the midbrain cluster during pretreatment and posttreatment; (e) scatterplot demonstrating a positive correlation between the midbrain A2W cluster difference and days abstinent from cocaine during follow-up (r=0.48, p<0.01). All contrast maps are thresholded at an uncorrected level of p<0.001 two-tailed and family-wise-error-corrected at p<0.05. Blue color demonstrates areas where subjects show relatively less activation at posttreatment vs pretreatment, and red color indicates where participants show relatively greater activation at posttreatment vs pretreatment. The right side of the brain is on the right. A full color version of this figure is available at the Neuropsychopharmacology journal online.

