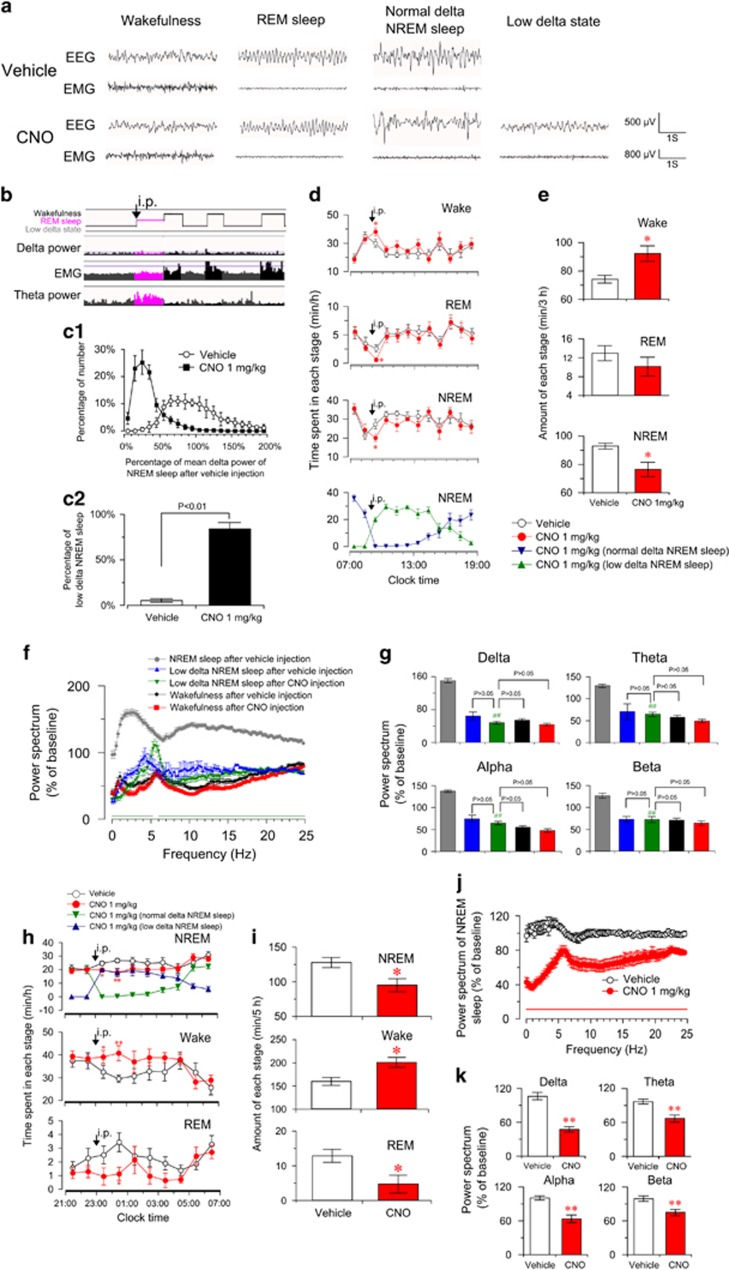
Figure 3.
Activation of basal forebrain (BF) cholinergic neurons slightly promoted wakefulness, produced low-delta non-rapid eye movement (NREM) sleep, and decreased electroencephalogram (EEG) power spectrum of NREM sleep. (a) Raw EEG and electromyogram traces of ChAT-IRES-Cre mice with bilateral hM3Dq receptor expression in BF cholinergic neurons following vehicle (top) and clozapine-N-oxide (CNO) (bottom) injection. Note the occurrence of low-delta state with low-delta and EEG activity after CNO injection. (b) Hypnogram shows that ChAT-IRES-Cre mouse directly entered REM sleep from CNO-induced low-delta state (black arrows). (c1) The distribution of delta power spectrum of NREM sleep episode during the first 4 h after the injection of vehicle and 1.0 mg/kg CNO (900 to 1300). Data were standardized and expressed as the percentage of the mean delta power of NREM sleep after vehicle injection of each mouse (n=6). (c2) The percentage of low delta NREM sleep episode in total NREM sleep episode after the injection of vehicle and 1.0 mg/kg CNO (n=6), assessed by the non-paired, two-tailed Student's t-test. (d) Time course of vigilance states following vehicle and 1 mg/kg CNO injections in ChAT-IRES-Cre mice (n=8 or 9). Horizontal open bars on x-axes indicate 12 h light periods. Note the presence of low-delta NREM sleep and significant decrease of normal-delta NREM sleep after CNO injections (bottom in d). *P<0.05 vs vehicle, assessed by repeated-measures ANOVA followed by the probable least-squares difference (PLSD) test. (e) Total amounts of vigilance states during the first 3 h after the injection (900 to 1200) (n=8 or 9). *P<0.05 vs vehicle, assessed by two-tailed paired Student's t-test. The comparison of EEG power spectrum of each state after vehicle or 1.0 mg/kg CNO injection (f, g) and the EEG power spectrum (including all states) after vehicle injection was selected as baseline. (f) EEG power spectrum changes over baseline during the 8 h after vehicle or 1 mg/kg CNO injection (n=7–9). Horizontal bars indicate statistical difference between NREM sleep after vehicle injection and low-delta NREM sleep after CNO injection (P<0.05), assessed by the non-paired, two-tailed Student's t-test. (g) Quantitative analysis of delta, theta, alpha, and beta power over baseline (n=7–9), ##P<0.01 vs NREM sleep after vehicle injection, assessed by one-way ANOVA followed by the PLSD test. Activation of BF cholinergic neurons increased wakefulness and decreased EEG power spectrum of NREM sleep in the dark phase (h–k). (h), Time course of vigilance states after injection of vehicle or 1 mg/kg CNO at 2300 in mice expressing hM3Dq receptors (n=8 or 9). Horizontal filled bars on x-axes indicate dark periods. *P<0.05, **P<0.01 vs vehicle, assessed by repeated-measures ANOVA followed by the PLSD test. (i) Total amounts of vigilance states for 5 h after injection (2300 to 0400, n=8 or 9). *P<0.05 vs vehicle, assessed by two-tailed paired Student's t-test. (j) EEG power spectrum of NREM sleep changes over baseline during 8 h after CNO injection (2300 to 0700, n=8). Horizontal bar indicates statistical difference (P<0.05), assessed by the non-paired, two-tailed Student's t-test. (k) Quantitative changes in the delta, theta, alpha, and beta power of NREM sleep epochs (n=8). **P<0.01 vs vehicle, assessed by the non-paired, two-tailed Student's t-test.

