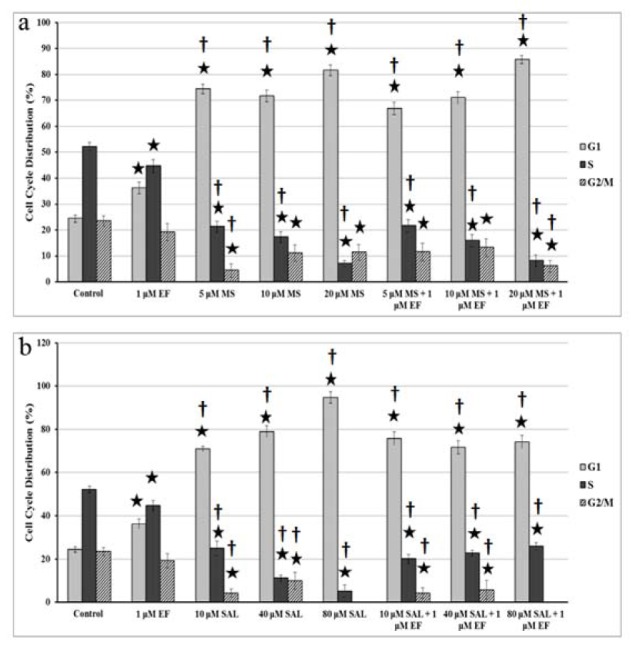
Figure 4. Effect of MS (a) and SAL (b) alone or in combination with EF on cell cycle by PI incorporation. Percentage of cells in each phase of the cell cycle (G1, S, and G2-M) is indicated. MS: MS-275; SAL: Salermide; EF: EF24.

* p < 0.001, versus control cells for 24 h
† p < 0.001, versus EF treatment for 24 h
