
Fig. 4.
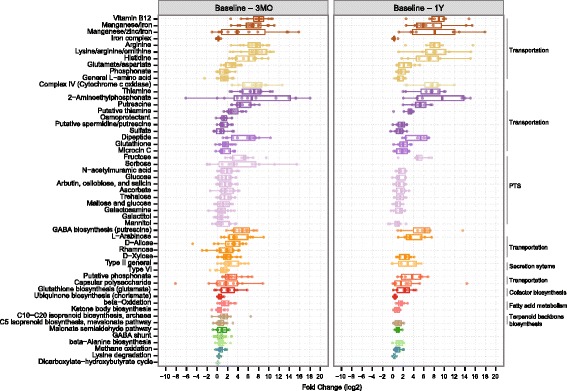
Microbial functional changes following RYGB. Box plots represent fold changes (log2) in the 53 KEGG modules that increased in relative abundance between baseline and 3 months (3MO, left panel) and 44 among these that increased between baseline and 1 year (1Y, right panel) after RYGB. The different KEGG functional categories are represented by different colors and grouped together when possible with corresponding labels at the right side of the plot. PTS phosphotransferase systems, GABA gamma-aminobutyric acid