
Fig. 4.
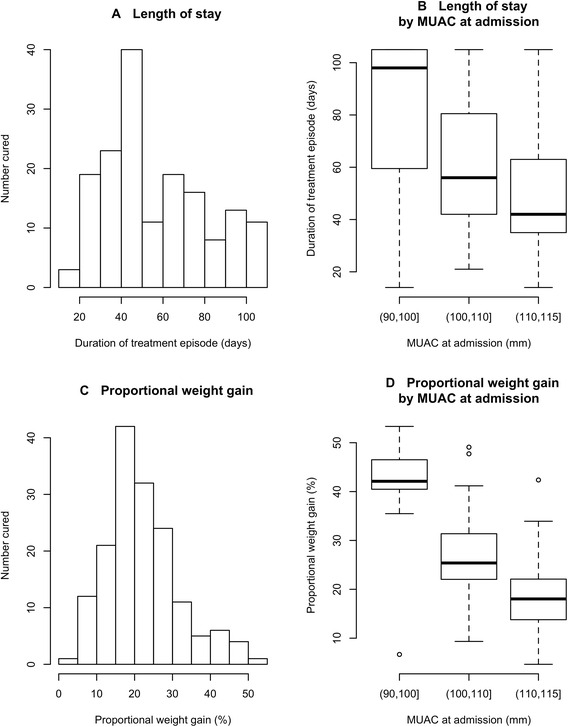
a Histogram showing distribution of duration of treatment episode. b: Box plots describing the length of stay for three classes of MUAC at admission c Histogram showing the distribution of proportional weight gains at discharge. d Box plots describing proportional weight gain at discharge for three classes of MUAC at admission