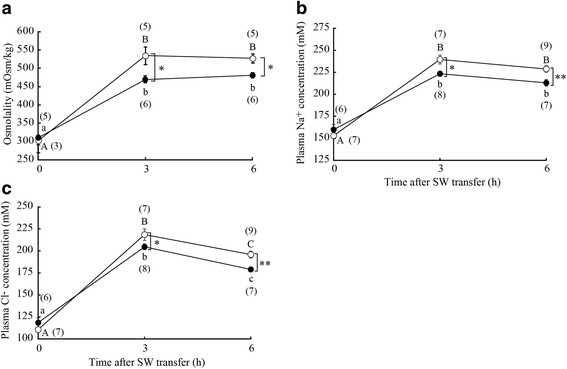
Fig. 2.

Changes in blood osmolality (a) and plasma Na+ (b) and Cl− (c) concentrations after direct SW transfer of SW-experienced medaka (solid circles) and control FW medaka (open circles). Values are means ± SEM. Numerals in parentheses indicate the number of samples examined. Different letters indicate significant differences within the same group (ANOVA, Tukey-Kramer multiple comparison test, P < 0.05). Asterisks indicate significant differences between the two groups at the same time points (two-sided Student’s t test, *P < 0.05 and **P < 0.01)
